
Here are some ways to better understand your results and identify areas for improvement.
Identifying actor overload
It can happen that one of your actors has too much work compared to his availability and therefore slows down your process. This can be easily found in the Actors tab:
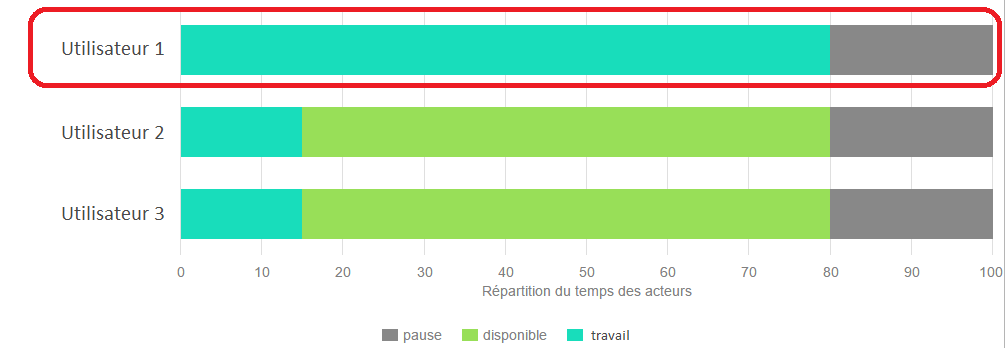
In the example above, we see that actor User 1 has no time available (light green), while the other two actors have an availability of more than 60%. It is very likely in a case like this that your process will be slowed down by User 1.
Spotting task overload
In the first histogram of the tab Task Details, you can also identify the load of a user :
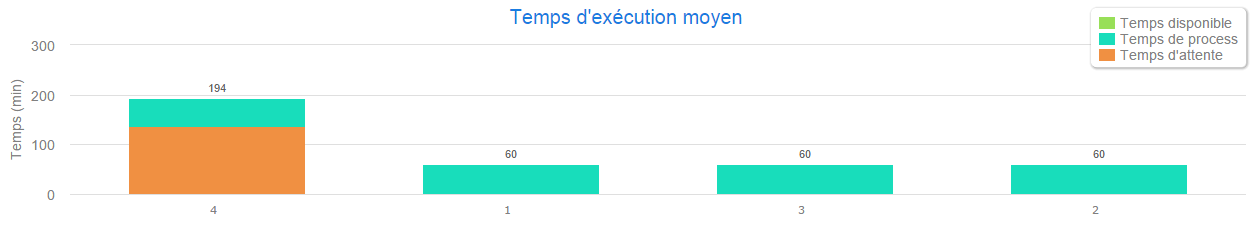
If the waiting time for one or all of your tasks is important, it is because the actors assigned to them are not available on average before the specified time.
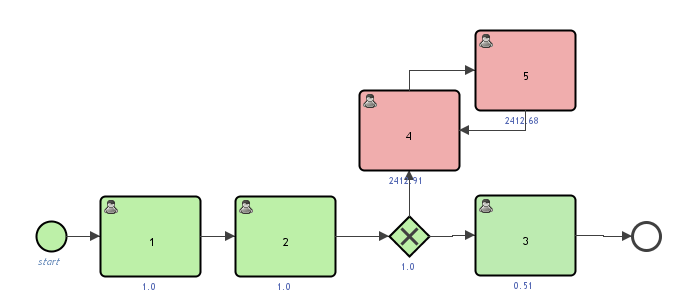
In the example above, we can see that the task 4 has a high waiting time compared to the other three. In a case like this, you can add additional actors for this particular task.
How do I add an additional temporary actor?
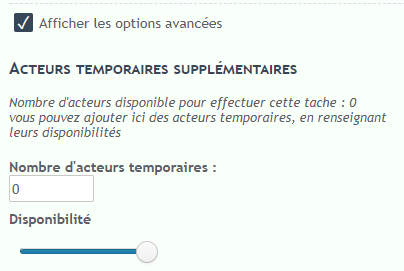
In the simulation configuration, select the relevant task and check the box Advanced Options.
You can then define an additional number of temporary actors to see how your process would behave with more resources.
In our example here is the result obtained with the addition of an extra actor:
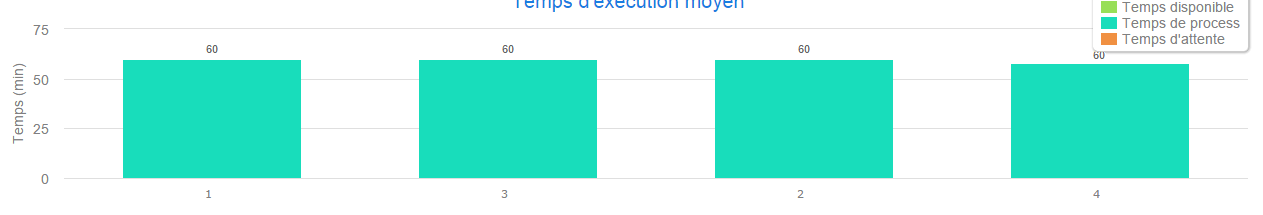
The overload problem is therefore solved.
Spot the overload in your process
By looking at the graph in the Summary tab, you can easily see how your process reacts to the appearance law you have set up.
Indeed, the red zone of the graph represents the quantity of current instances as a function of time.
In the example below, we can see that the graph on the left shows that the system is working well, with a constant number of running instances as a function of time. The graph on the left, on the other hand, clearly shows that your process is not holding up.

Locating a blocking process
It may happen that your process is misconfigured or poorly modeled. As a result, it is not possible to finish an instance. You can see this quickly in the tab Summary.
If you want to find out where this blockage comes from, you can go to the tab Diagram.
Select the view by average run count, total run, or number of current instances.
If your process is blocked by an infinite loop for example, your loop will be coloured red.

