A template is a “common structure” shared by several users. The information visible in the TDB “template” will be different depending on the selected control variables (also called “dashboard variables”).
The selectable driving variables are predefined in the template configuration.
This is useful when you want to share a TDB by limiting/restricting the data that will be accessible/visible to users/groups.
The objective is therefore to allow the user to whom the dashboard is shared, to have access to the information that concerns him by linking the TDB variables with the widget variables that determine the display.
Create and configure a template
First step, create a dashboard.
Create a dashboard
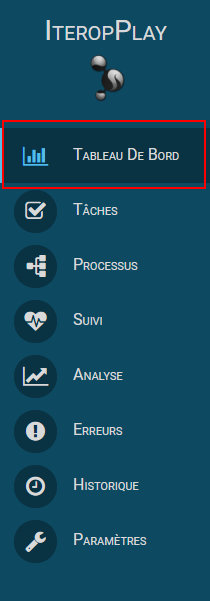
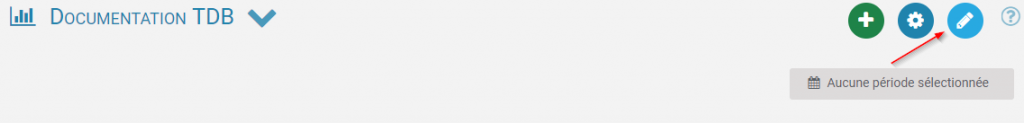
Go to PLAY and then to the Table De Bord tab.
At the top right of the page, click on the green ( + ).

A window opens up for you.
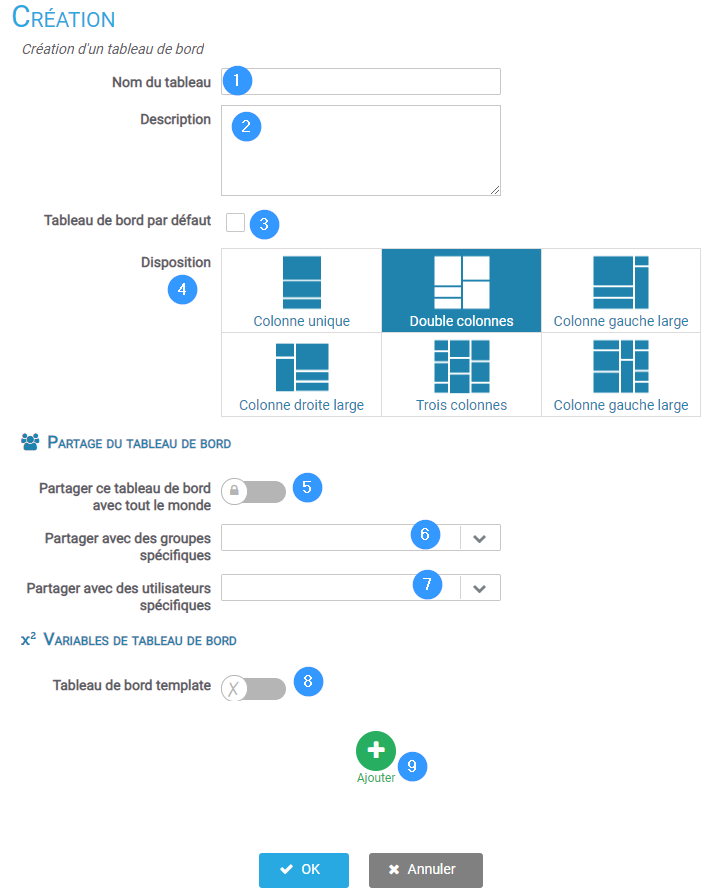
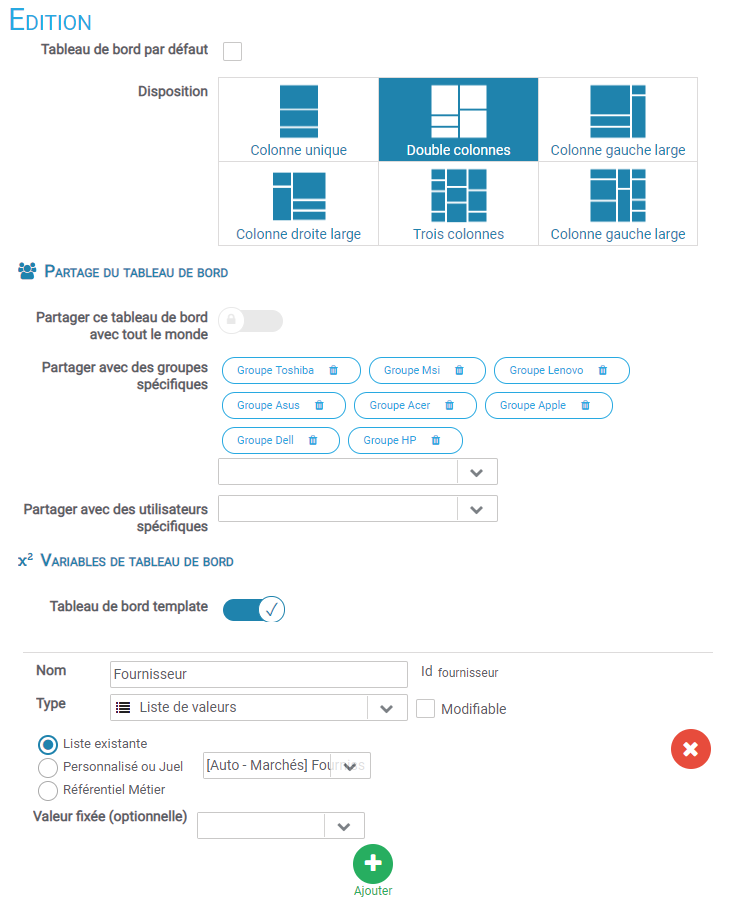
1️⃣ The name of the dashboard
2️⃣ His description
3️⃣ Will it be the default TDB? (displayed directly when you go to the Dashboard tab)
4️⃣ The layout of widgets
5️⃣ Is it public?
6️⃣ Share it with user group(s)
7️⃣ Share it with user(s)
8️⃣ Will it be “template”?
9️⃣ Add dashboard variables that will be used to adapt the data that can be viewed
If the TDB template mode is activated, when you click “OK”, a configuration window will open. Refer to chapter [Mettre lien du chapitre “Partager le template”] for this.
At least one TDB variable must be determined in order to link it to the widgets.
Create a dashboard variable
You have just clicked on the small green ( + ) (9️⃣ of the last capture).
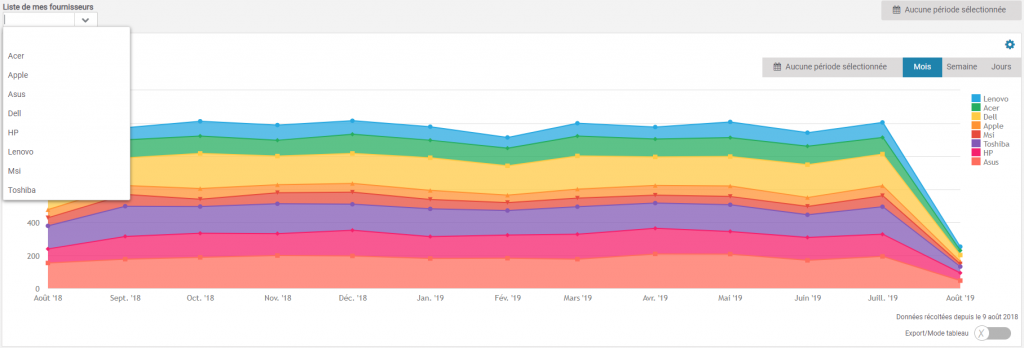
Now you need to specify which variables you want to use that will change the display of the widgets (elements) in your dashboard.
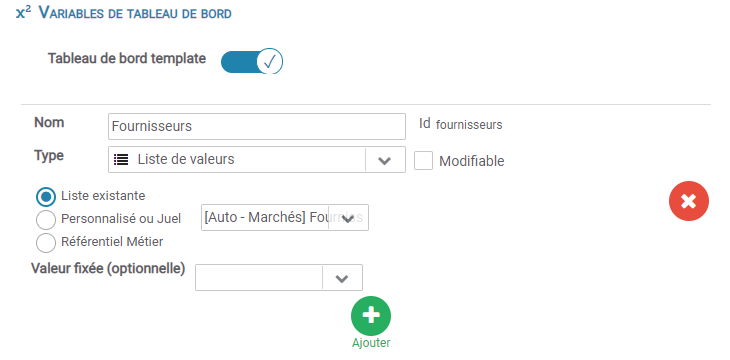
In the screenshot above, a list (and the values it contains) will be used to indicate which supplier’s information you want to display.
Now you have to create the widgets and their variables in order to link them.
Create a widget and link its variables to those of the TDB
Click the widget configuration button.
Add a new widget.
Select the desired widget type.
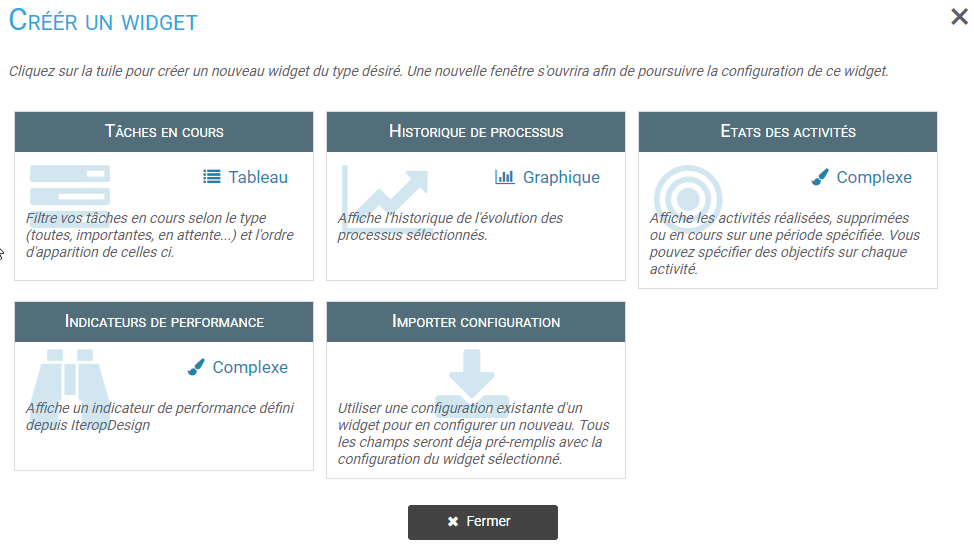
For this example, the widget will be a Performance Indicator.
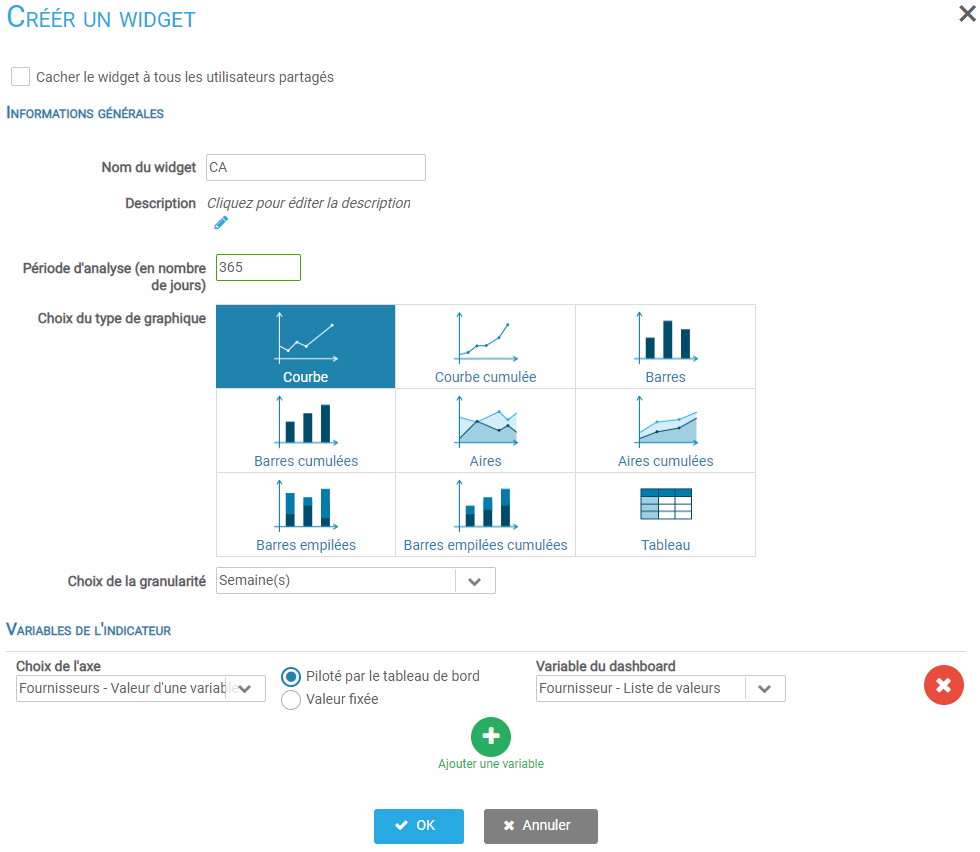
The following view is displayed:
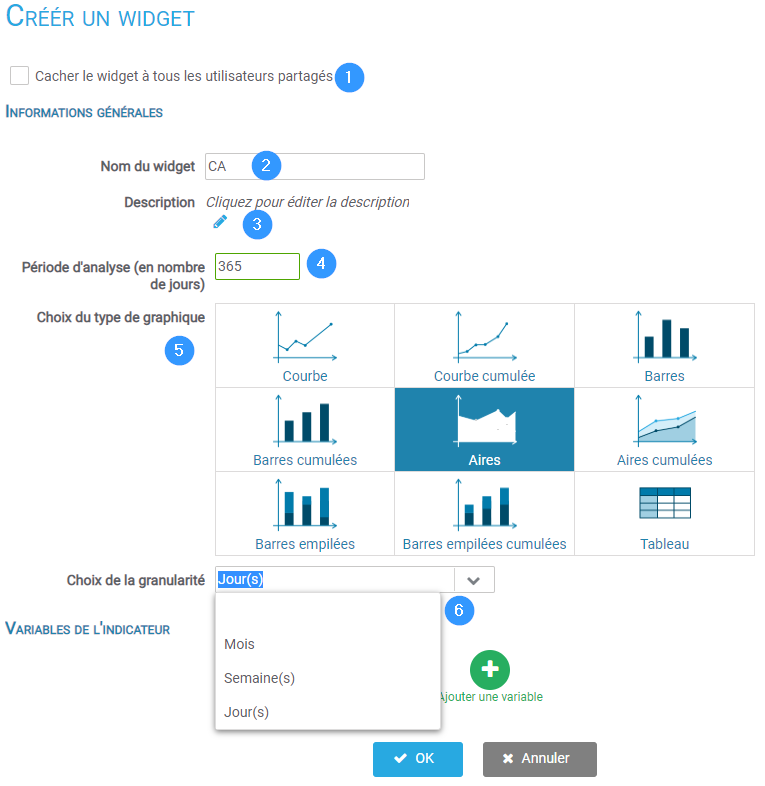
1️⃣ If checked, the widget will only be visible to you
2️⃣ The name of the widget
3️⃣ Its description (optional)
4️⃣ The granularity of the display
5️⃣ The desired type of graphic
6️⃣ The default display accuracy (can be changed on the TDB display, see the appropriate chapter)
Press “Add Variable”
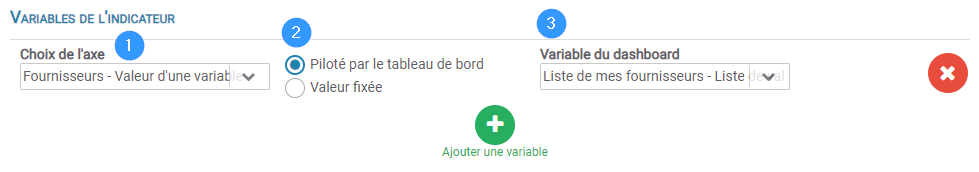
1️⃣ The KPI axis you want to link to one of your TDB variables
2️⃣ The KPI axis depends on a TDB variable or can be fixed.
3️⃣ Select the TDB variable you want to link
Thus, you have linked the widget variable “Suppliers” (which represents an axis of the KPI) to the TDB variable “List of my suppliers”.
Filter by period
It is now possible to filter the KPI data by selecting only the period you want.
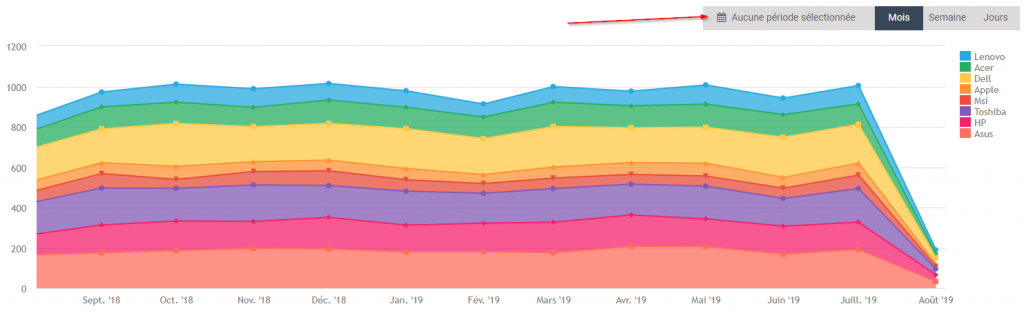
After clicking on the period selection button, the following window opens up for you:
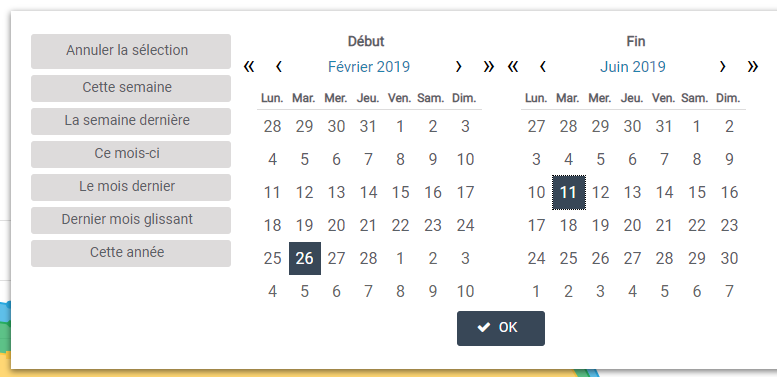
You can select a defined period of time, or define it yourself. This will make the visualization more accurate.
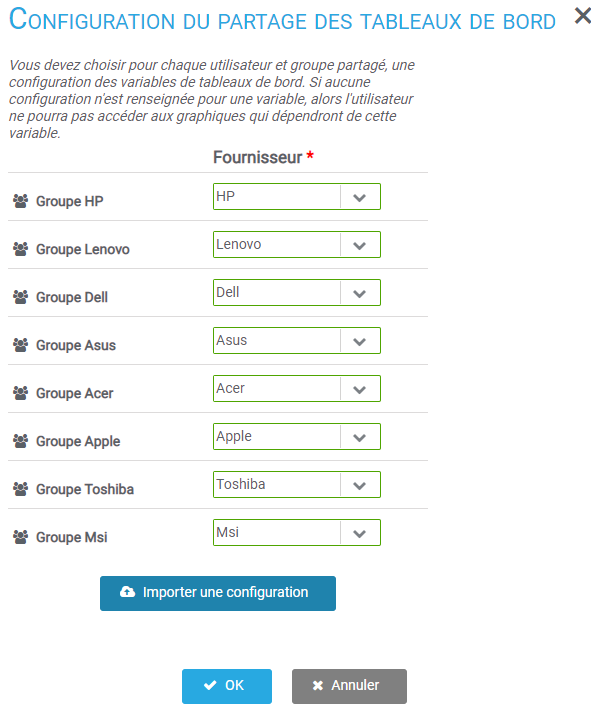
Share the template
With the “template” option enabled and the “OK” button in the TDB creation or edition window clicked, you are asked to configure the sharing of dashboards.
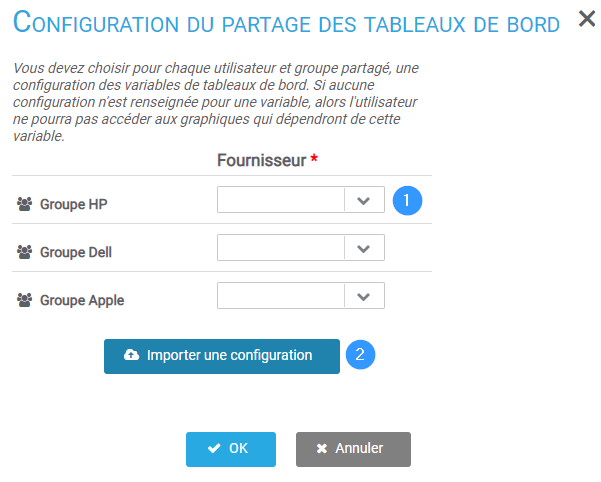
On this view, it is requested to assign “The *** group will have access to the *** value of the dashboard variable”.
1️⃣ Select the value of the Supplier variable that will be used by the “HP Group” group.
2️⃣ Import a configuration if too much association needs to be made. (See paragraph [Importer une configuration]
Example of a simple configuration :
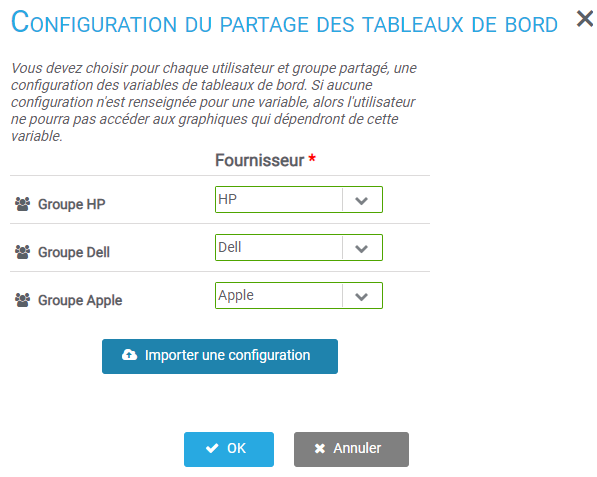
Members of the HP group of companies will be able to have the information relating to the HP value, those of the Dell group of companies will be able to have the information relating to the Dell value …
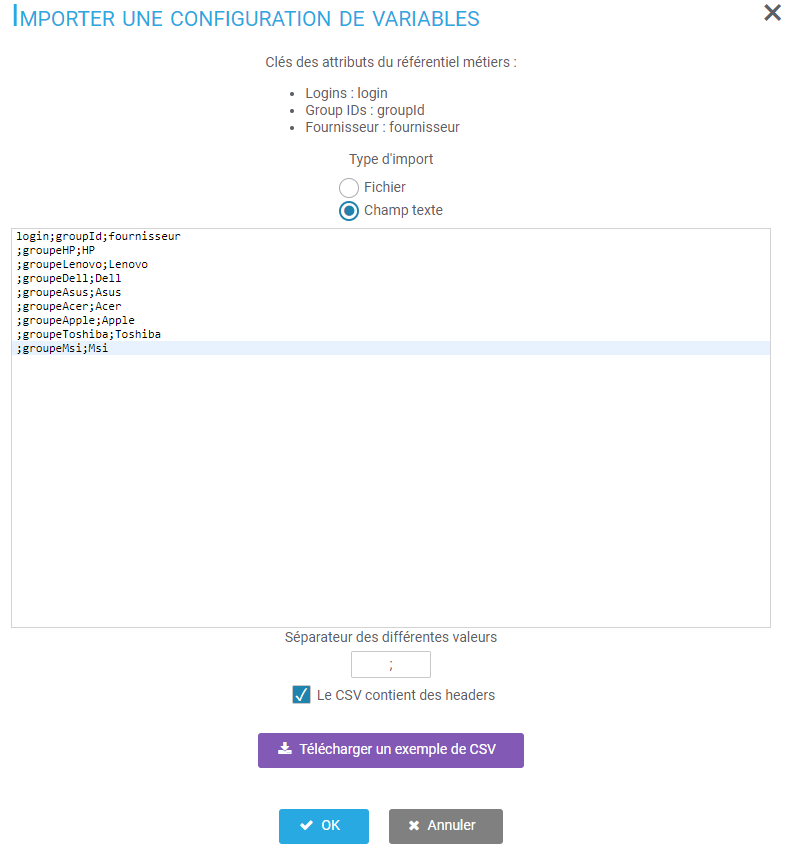
Import a configuration
File View
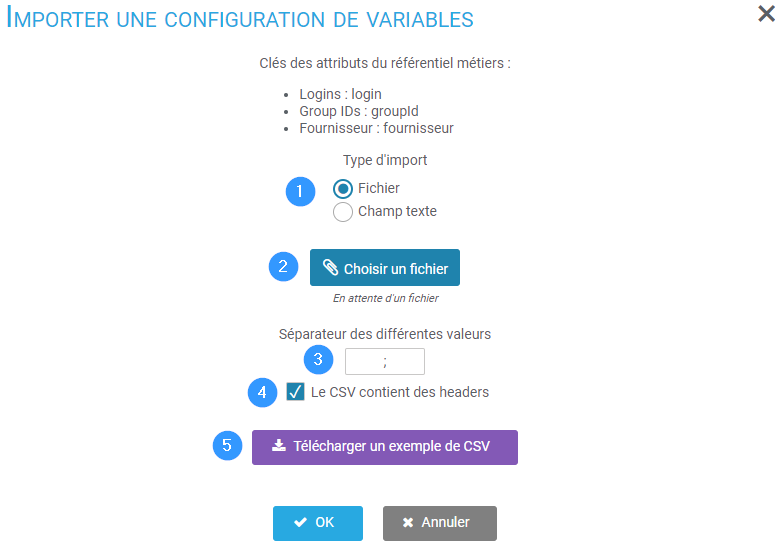
1️⃣ Choose to import a file (where the configuration will be present) or to fill it directly in a text field.
2️⃣ Import the CSV file.
3️⃣ Specify which separator separates the items in your configuration
4️⃣ Specify whether the CSV file has headers or not.
5️⃣ Download an example of CSV so that you can complete it.
“Text field” view
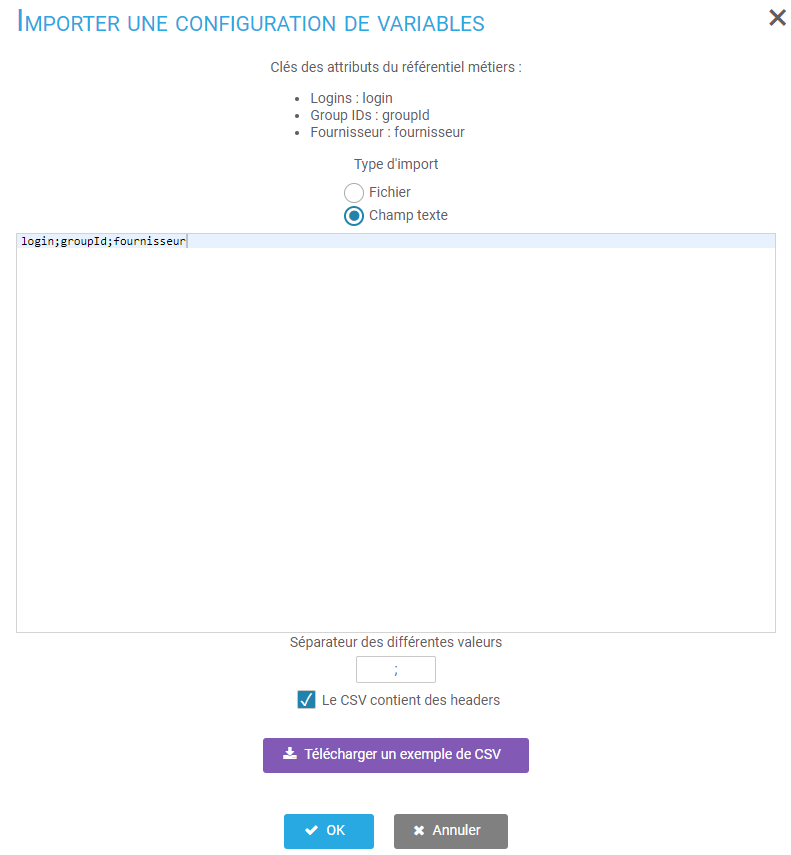
The content of the file or text field will be the same:
You have to indicate the id of the user or group to whom you want to share the TDB and the value of the variable that will be associated to it.
For example:
login;groupId;fournisseur
gerard.dupont;;Apple
;GroupeHP;HP
Fill in Gérard Dupont’s login, leave the space reserved for the group id empty and indicate that he will have access to the information relating to the value “Apple”.
Then we indicate no login since we configure the access to the information of a group, then we indicate that “HP Group” will have access to the information related to the value “HP”.
If a manager requires access to postings from multiple suppliers, it will be sufficient for him or her to be in the appropriate groups.
Caution: In order for users to have access to the desired Performance Indicators, they must be “public” or the user must be “Supervisor”.
Use cases
A company that sells computer equipment has purchasing managers. They are “assigned” to a brand/supplier and will have to have a dashboard adapted to them.
Louise DURANT (Sales Manager), for her part, will have to have access to the data of the 8 suppliers who work with the company, so she will have to be part of the 8 groups.
Manual configuration :
Important configuration :
Both configurations allow the same result.
We create the widgets that purchasing managers will see. (KPI for example)
It is indicated that the widget variable (or KPI axis) “Providers” is associated with the value of the TDB variable “Provider”.
Result for a user who is part of the “Apple Group” :
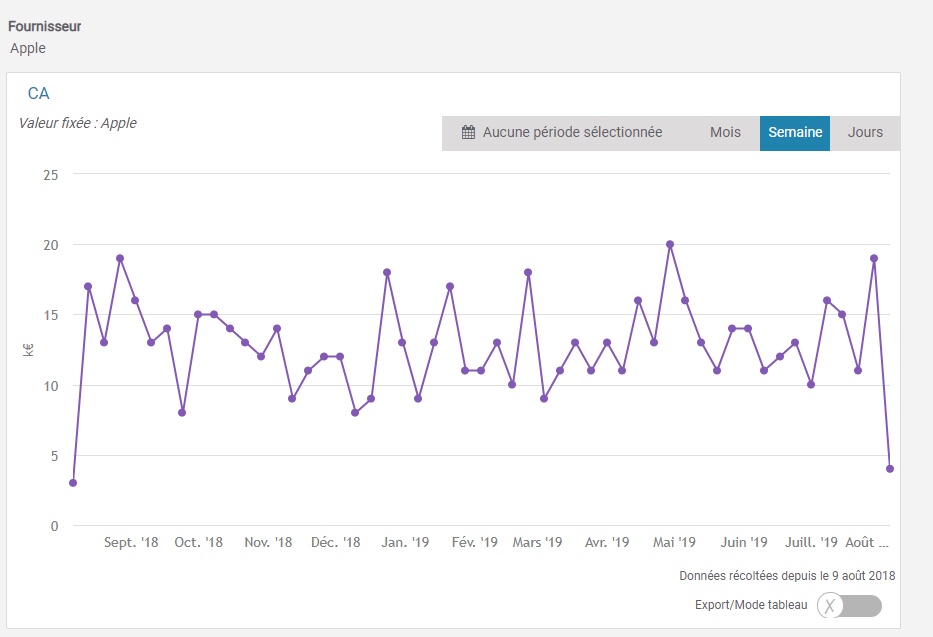
It does not have access to data from other providers (unless it integrates other groups).
Result for the Sales Manager (part of the 8 groups) :