Consult and research processes
In IteropPlay, you have the possibility to view the processes you have started, whether they are running, completed or deleted.

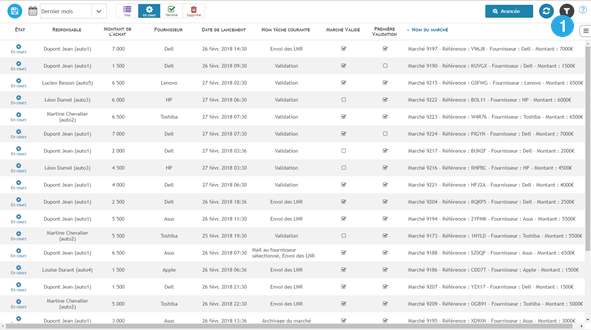
- Click on the tab “Follow-up” in the menu on the left 1️⃣
- Choose a filter that you have registered or pre-configured 2️⃣
- Choose the period and status of the processes you are looking for in 3️⃣
- The processes are displayed in the 4️⃣ section.
- You can then colour the rows and load the data in order to analyse the processes, filter the results 6️⃣ or export your results in .csv or Excel format 7️⃣
- You can also search for a process directly by name or via a data 5️⃣
Click on a process in the 4️⃣ section to view the status.
Sorting processes in tracking
Click on one of the table headers in the area above your process list to sort them.
- For example, if you click on the header :
- Identifier : sort alphabetically by process identifier.
- Duration: sorts processes according to their execution time.
- Start date : sorts the processes according to their creation date. From the earliest to the latest date or vice versa.
- Creator’s name : corresponds to the user who initiated the process.
Using the search bar
- Select the search bar 6️⃣ at the bottom of the page.
- Type your search in the empty field (identifier, name of a process, name of the creator of the process)
- Click on the magnifying glass? or press Enter to start the search
- To reset the search, click on the cross ❌.
Perform a simple process search
In Iterop Play, you have the possibility to view the processes that have been completed or deleted.
- Click on the “Follow-up” tab in the left menu
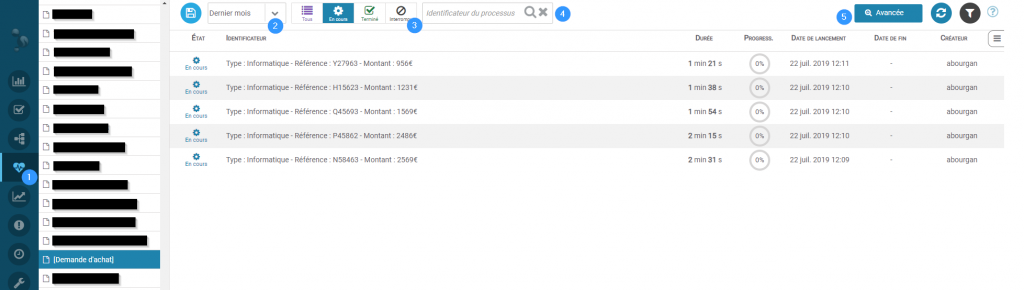
- At the top of the interface, you can choose several search criteria :
- In 1️⃣ select the process you want to view. You can choose to search for multiple processes by selecting one of the two filters “Processes in progress this month” or “Processes completed this week”. In this case, some options will not be displayed such as progress or form data retrieval.
- In 2️⃣ select the time period in which the process was started. For example: select “Last week” to display all processes (including terminated ones) that will have started during the last week.
- In 3️⃣ choose the status of the processes to be consulted.
- All : no status filtering
- Ongoing: Processes that are not completed
- Terminated : Processes that terminated during normal execution
- Deleted : Processes that have been manually stopped from the control or design interface
- Each time a change is made in the search fields, the search is automatically launched and displays the processes meeting the criteria in the main table. You can view the details of a process by following the chapter Viewing and Analyzing Process Steps.
- You can search by indicator using the search bar .4️⃣
- You can restart the search with the same criteria by pressing the ♻ refresh button.
- If you want to refine your search, you can use the advanced search located in the 5️⃣ section.
Display and compare entered process data
In the tab “Follow-up“, it is possible to compare all the data of your started processes. This enables you to see all the data that has been entered for each of the processes.
- Select the process you wish to consult 1️⃣ and play with the selection criteria to refine your search 2️⃣
- The processes are then displayed in 3️⃣
- Data for the selected process is displayed in the table 4️⃣. These are the key process data configured from Iterop Design. ⚠ Only data considered as “key data” by an administrator are displayed directly.
- By clicking on 6️⃣ , you can choose to show or hide other data from the process:
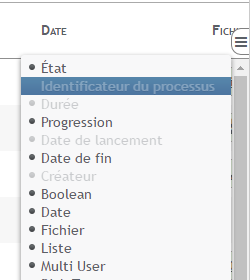
- The data columns are then displayed in the 7️⃣ section.
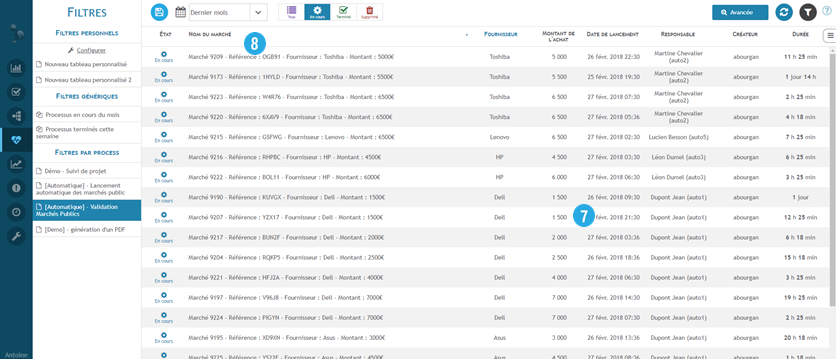
You can sort the data in the table by clicking on the column headings 8️⃣ (the headings depend on the information that has been requested).
You can also filter the results using the search bar at the bottom of the Process Manager, which will also filter the data displayed on the screen.
It is also possible to change the order of the columns to create a very personalized table. Simply drag and drop the column header 8️⃣ between two other columns to change the display order.
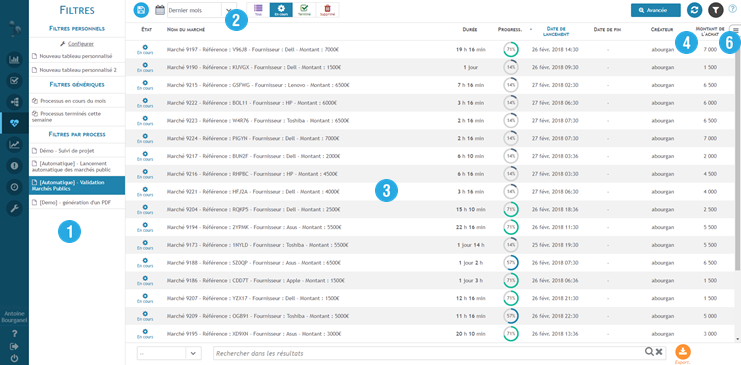
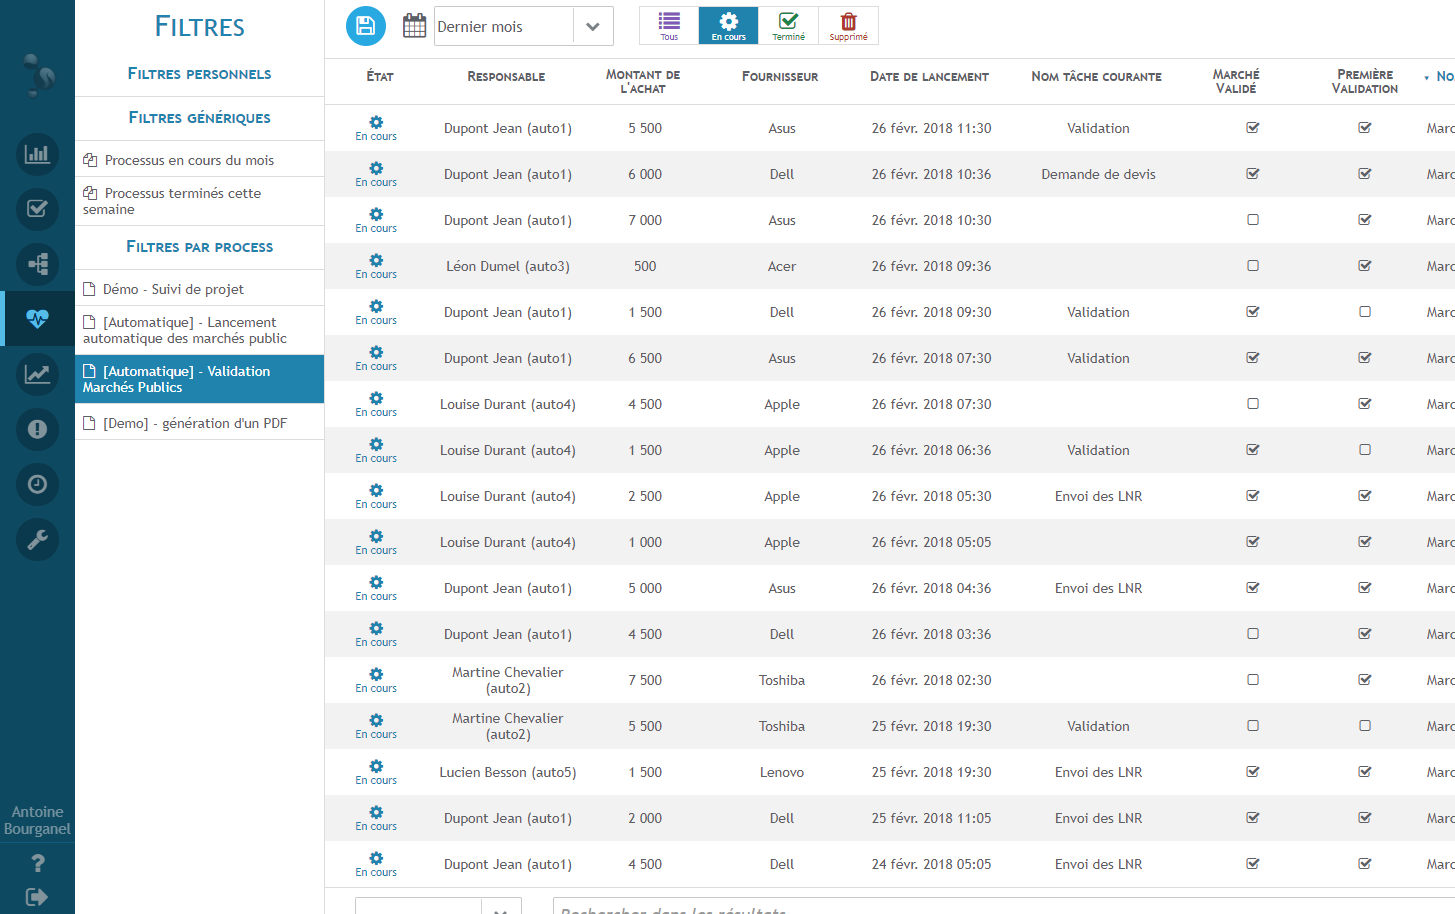
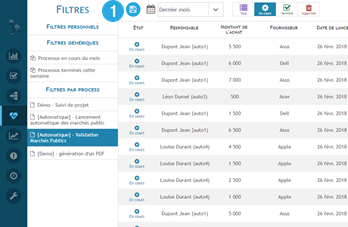
Example with the painting of a buyer
We have removed columns that we thought were unnecessary for a purchasing management process, such as progress, and we have added the columns of the people in charge to know at a glance who is in charge of the purchase :
Setting up and saving a custom table
Once you have configured a custom tracking table, by choosing the recovery criteria, the columns to be displayed or not, the order of these columns, it is interesting to save it for later consultation.
To do this, once the table has been configured :
- Click on the save button 1️⃣ at the top of the table.
- A window opens, asking you to choose a new name for your filter.
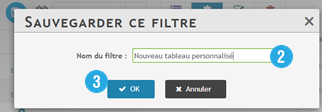
- Enter the name of the filter in 2️⃣ then click ok 3️⃣
- The new filter then appears in the left-hand menu 4️⃣
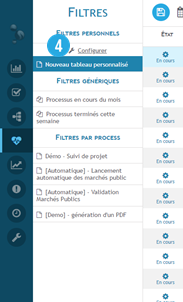
You can click on Configure 4️
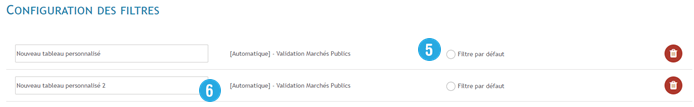
- In this new view, you can delete a previously configured filter and change its name 6️⃣
- You can also choose a default filter 5️⃣ which will be displayed first after your connection in Iterop Play
Perform an advanced process search
Compared to the simple search, the advanced search allows you to specify other search criteria. Go to the tab “Follow-up” then to the tab “Search” to access the advanced search.

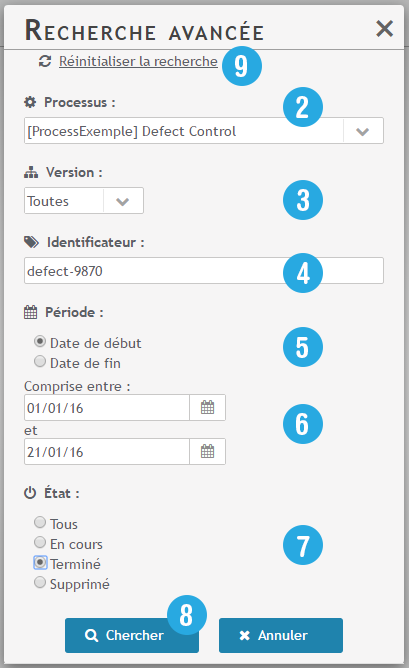
- Click on the button Advanced Search 1️⃣
- The advanced search window above opens
- As in the simple search, you can select a specific process or not (2️⃣) as well as the status of the process (7️⃣)
- If you choose a specific process, you can select its version 3️⃣ – indeed, each time a process is modified from Iterop Design, the version is automatically incremented – and search for example all the processes still started from an old version.
- You can fill in a particular identifier 4️⃣ the search retrieves all the processes whose identifier is close to the one filled in.
- At 5️⃣ and 6️⃣ you can enter a search period and the period type :
- Start date : period during which processes are started
- End date : period during which the processes have ended (no running process can then be retrieved)
- Finally, click on Search 8️⃣ to start the search. The results will be displayed in the main tracking table.
- To reset all the fields of the advanced search, you can click on Reset Search 9️⃣ to clear all fields
Filter the result of a search according to its data
It is possible to filter the results of a search according to the data.
For example, it is possible to only want to recover processes whose purchase amount exceeds 5000€ or for an HR recruitment process, only processes whose application has been validated. The column filter must be used:
- From your personalized tracking table, click on 1️⃣
- A window opens. In this window, all available columns can be filtered:
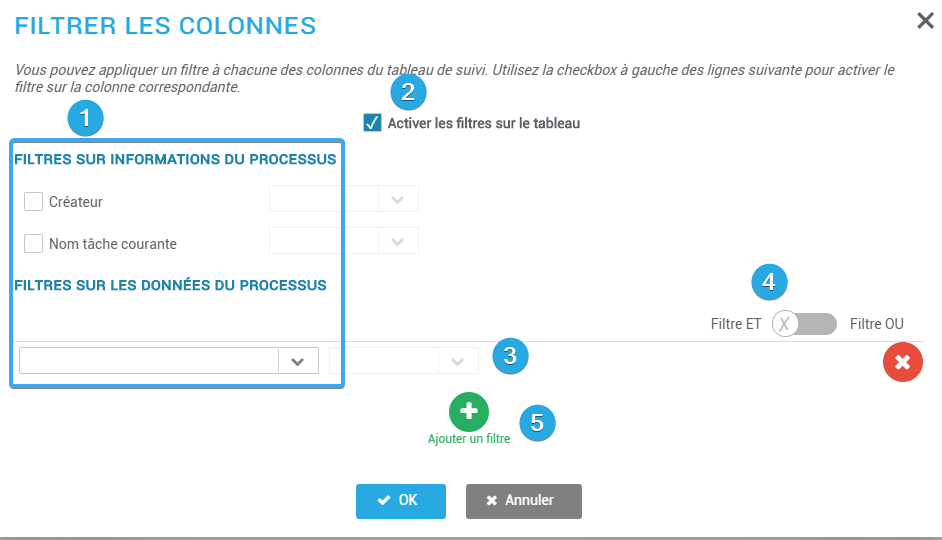
1️⃣: Enable/configure filters on common or process-specific variables
2️⃣: Quickly activate or deactivate all configured filters
3️⃣: Choose the filter such as “Value entered” or “Is equal to”.
4️⃣: Choose an “AND” filter (the displayed processes must satisfy all the configured conditions) or an “OR” filter (the displayed processes must satisfy at least one of the conditions).
5️⃣: Add a new filter on a variable (it is possible to apply several filters on the same variable)
To filter the processes that have a purchase amount over 5000€ :
- In the process variables 1️⃣, select the variable “Purchase amount” then “Included between” in 3️⃣
- Enter 5000 in the first field and leave the second field blank so that no limit is set.
That means then we want to retrieve the processes whose data “Purchase amount” is between 5000€ and “No limit“, which means “More than 5000“.
- Click on OK.
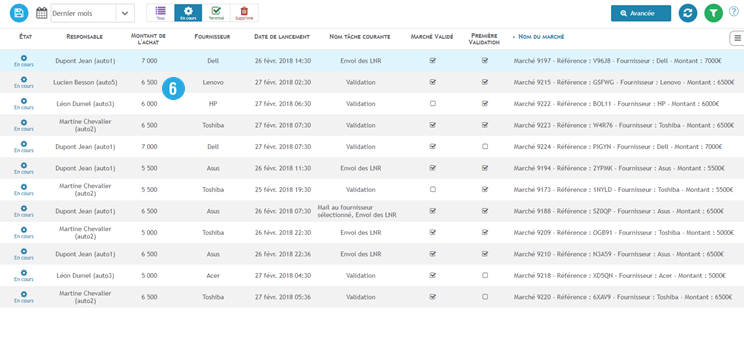
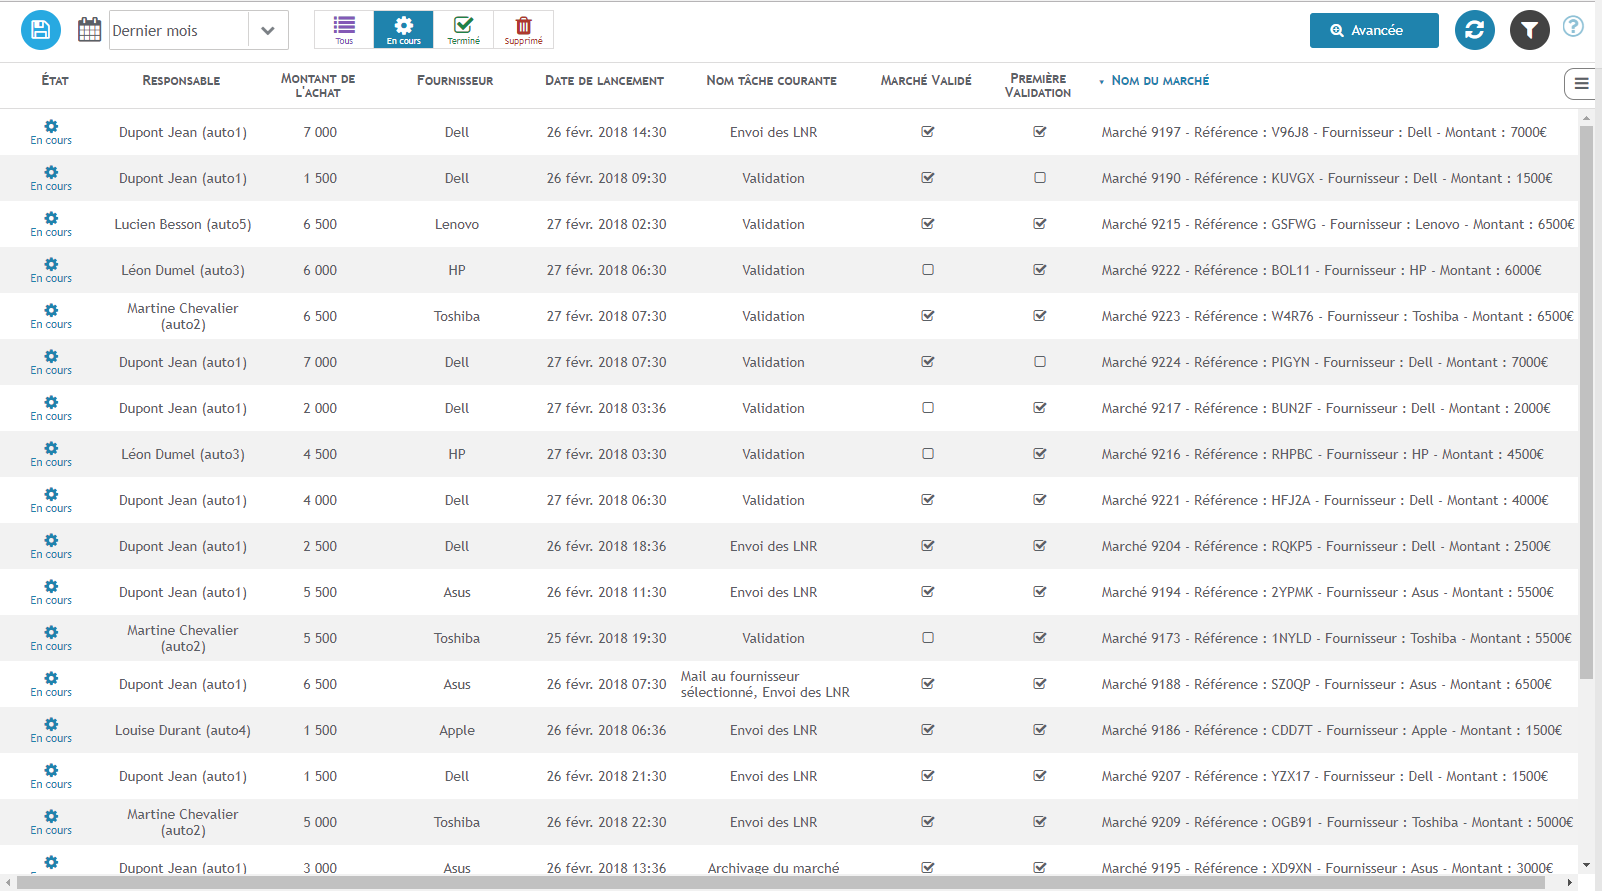
- You can see in the column 6️⃣ that the amount is never less than 5000 €.
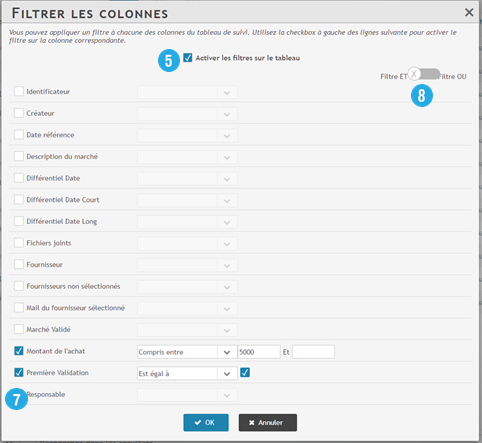
- Add a second condition by selecting the variable “First Validation” then “Is equal to” and check to indicate that the boolean must be “true”.
Column filtering is retained when saving the table (See Saving a Tracking Table).
Consult and analyze the steps of a process
Once you have selected a process in the ongoing processes (see Tracking its processes#Ongoing processes) or in the completed processes (see Completed processes), a page with all the information about this process is displayed. It is then possible to navigate through the information from the tab bar at the top of the page:

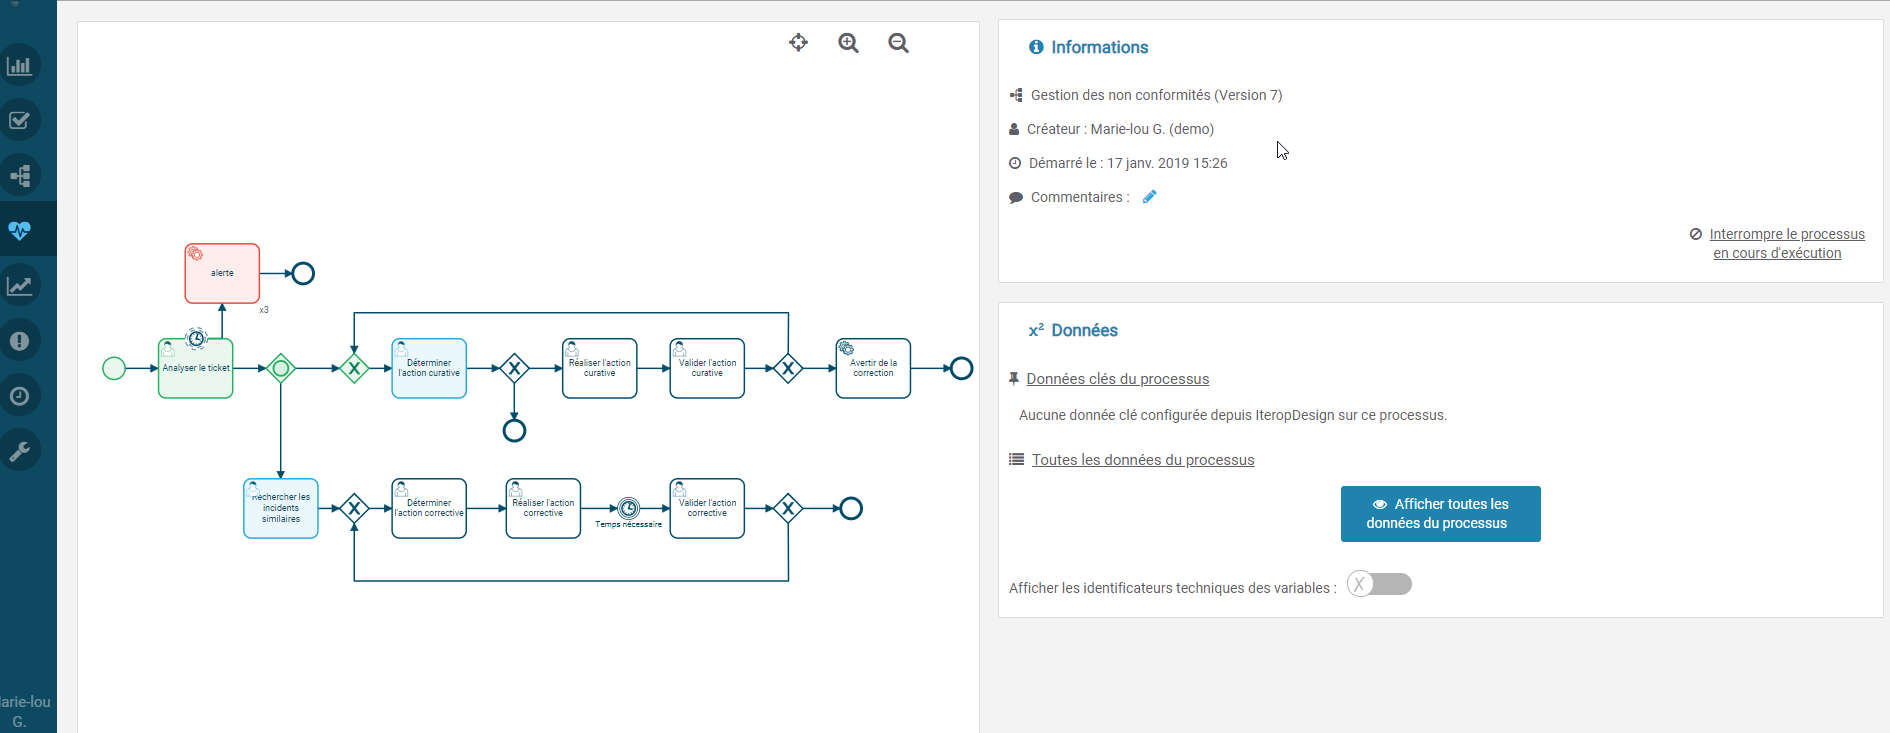
See general process information

- Click on the tab “general information” 1️⃣ to display all global information of the process
- The general information of the process (identifier, start date, creator…) is displayed in the frame “Information” 5️⃣ and the data of the process are displayed in the frame “Data” 6️⃣ (This is the data communicated by the users)
- The diagram 4️⃣ allows you to analyze the process monitoring and see which tasks have been performed
View process data
All data relating to the process you are viewing is displayed in the group box 6️⃣. If you are the controller of this process and it is not finished, edit buttons will appear in front of each of these data ( ) so that you can modify them. (See Modify a data item)
Analyze the process flow of a process using the flowchart
The diagram on the left side of the screen 4️⃣ shows you the overall process flow. The activities are colored according to their status:
Waiting
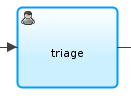
The activity has been started but is on hold.
No user has assigned the task to himself.
In progress
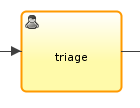
The activity is started and a user is taking care of the task. If the user abandons the task, the status returns to “pending”.
Completed
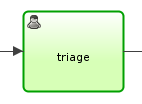
The activity has been carried out.
Second pass (x2)
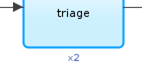
In processes containing loops, an activity can be performed several times. The number of passes is indicated after the “x” .
Not started
The activity has not yet started.
Deleted
The activity has been discontinued. This state is possible if a timer has forced it to finish or if the task is located in a sub-process and that sub-process has finished before the completion of this activity.
In error
The activity is in error. Go to the Errors tab to resolve issues related to this activity.
See Handling Errors
See the detail of the activities of a process
It is possible to view information on all the activities that have been started in the process. The information displayed depends on the nature of the activity (human task, automatic task, mail sending…).
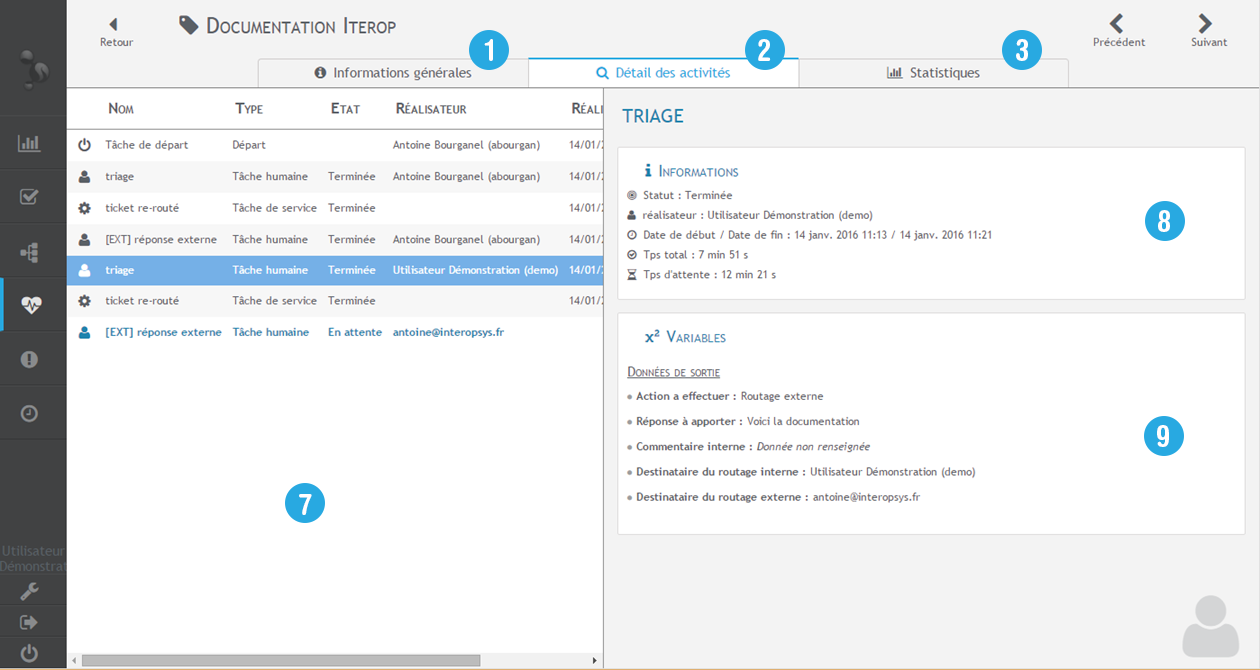
- Click on Details of activities 2️⃣
- The information for all activities appears on the screen (see screenshot above).
- Consult the main information of the activities in the table 7️⃣ (type of activity, status, director, date of completion)
- Select a completed activity from the table 7️⃣ (lines written in black) to access its details 8️⃣ and 9️⃣
- Select an uncompleted activity from the table 7️⃣ (lines written in blue) to have access to additional control options (if you are a controller of this process, see Controlling and Changing Processes in Progress)
Consult the average duration of the processes in progress
To efficiently monitor the progress of your processes and their efficiency, you can view their progress, total time and average task execution time using the colorization feature.
- Click on the “Ongoing” tab in your process tracking
- Select from the list on the left, the process you want to view
- The following buttons appear at the bottom of your Process Manager :
- Choose the colorization you are interested in:
- Color by Progress : corresponds to the progress of the process. In general, the progress is evaluated on the number of tasks completed in relation to the total number of tasks requested.
- Color by Total Time: corresponds to the total time elapsed since the process was started.
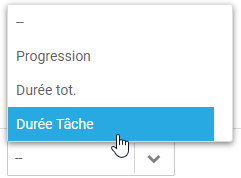
- Colour by Task Duration: corresponds to the duration of the last task started.
- Color by Progress : corresponds to the progress of the process. In general, the progress is evaluated on the number of tasks completed in relation to the total number of tasks requested.
- When you click, your manager is updated and the lines are colored:
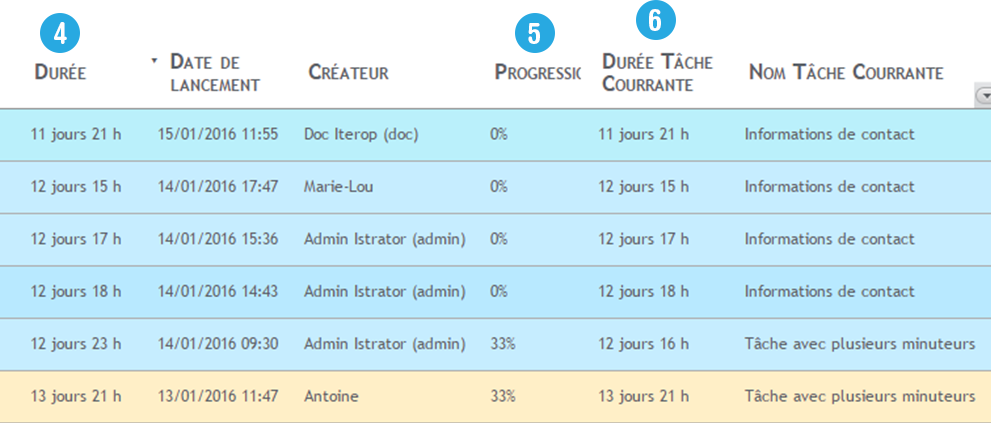
In the column 4️⃣, you can see the total duration of your process.
In the column 5️⃣, you can see the Progress of the process in percentage.
In the column 6️⃣ you can see the average duration of the last task started.
Locating locked processes
The colorization feature allows you to identify blocked or abnormally long processes.
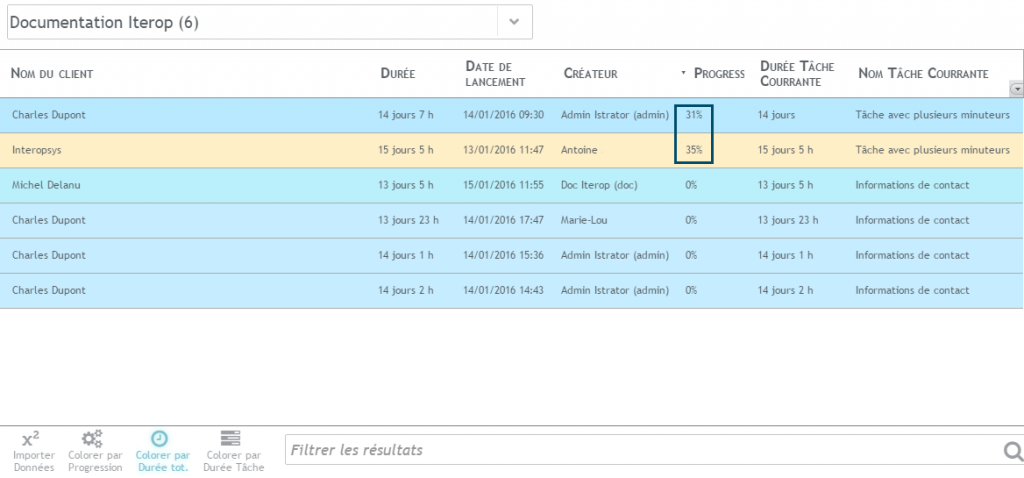
- Click on “Colour by Progression” in the 3️⃣ section.
- Sort your table using the column Progression 5️⃣
- Then click on “Color by Total Time” in process tracking
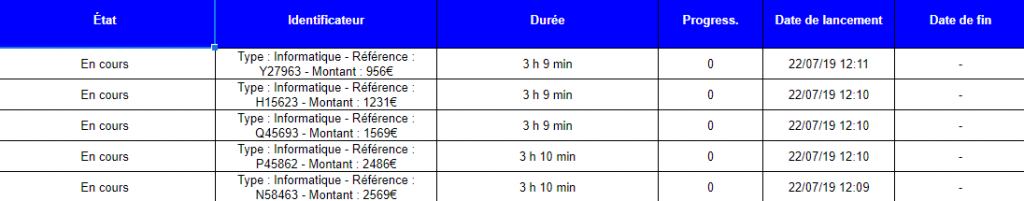
- Look at processes that have a roughly similar progression.
- Processes displayed in yellow, orange or red mean that they have a slightly longer or much longer than average duration. In our example below, two processes have a similar progression but one is shown in yellow. It is possible that this process may be blocked.
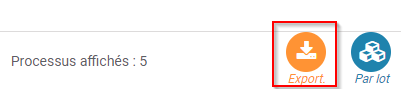
Export tracking
You can export all the data corresponding to your search (filters, sorting, etc.) with no limit on the number of processes.
To do this, click on the orange export button, located at the bottom right of the Follow-up window:
You will have the possibility to choose between Excel (.xls) or CSV (.csv) format as well as the date format :
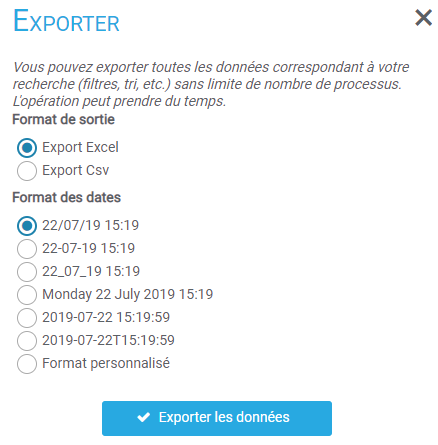
Result of the export :