
In IteropDesign, select “Create a new indicator” and Define from template. This window opens:
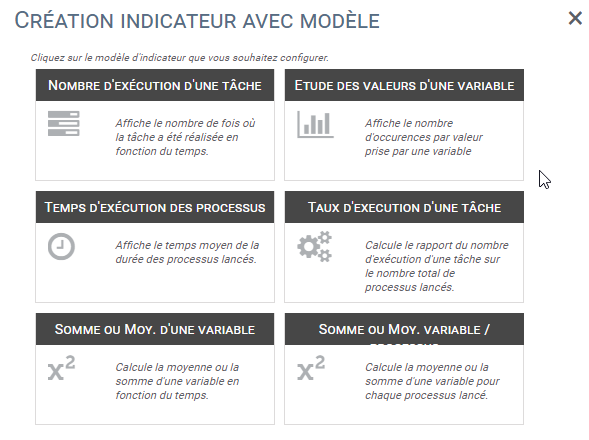
Here is a brief presentation of the different templates available to you.
1/ Number of passes through a task
Use
This flag allows you to measure, by date, the number of times your process has passed through a task.
For example, if your process contains an error branch, it might be interesting to know the number of times it has passed through this branch.
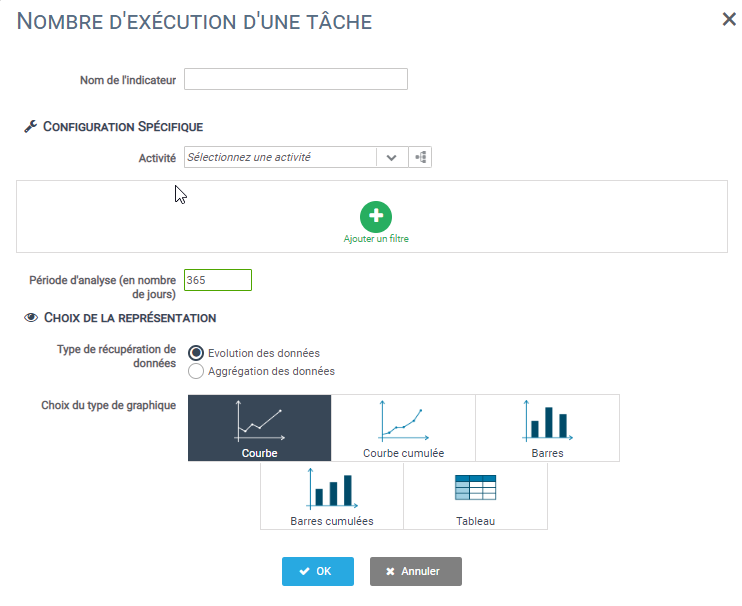
Configuration
The only configuration you will have to do is to choose the task you wish to observe and the desired visual representation.
- To select the task to be studied, you can either use the drop-down menu or click on the process icon. This will open a window with a graphical representation of your process. You can then click on the task you wish to study.
- The other step is to choose the graphical representation of your KPI.
2/ Process execution time
Use
This flag displays the average execution time of your processes based on the launch date. This will make it easy for you to monitor the health of your process.
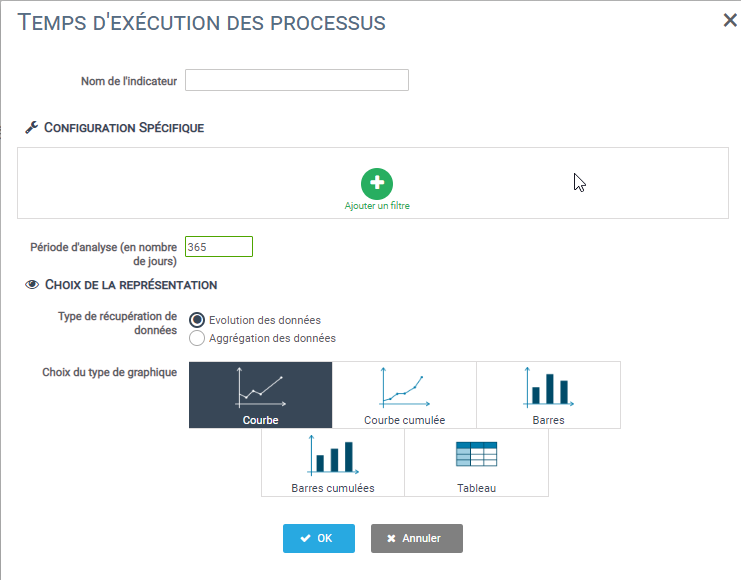
Configuration
As the process under study is already defined, no specific configuration is required for this indicator.
You will only have to choose the graphical representation of your KPI .
3/ Rate of passage through a task
Use
For example, you can set an indicator that shows you the rejection rate for a purchasing process for example.
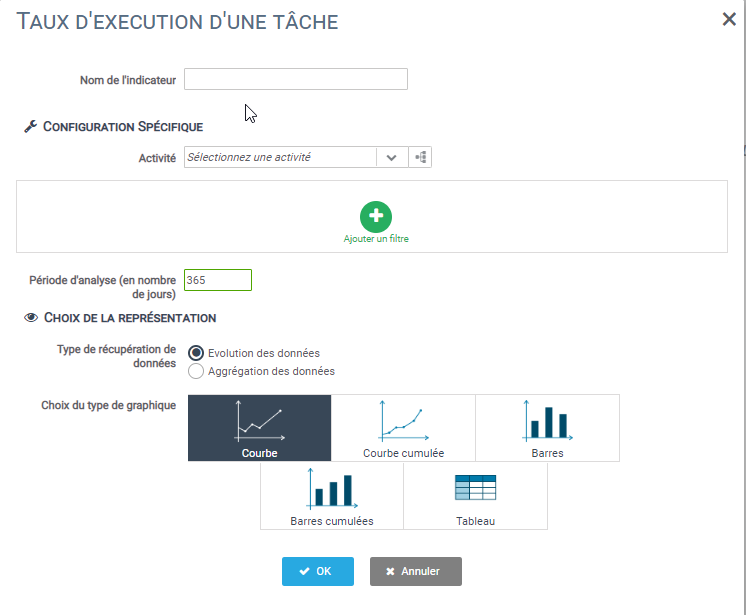
Configuration
The only action to be performed is to choose the task you wish to observe and the desired graphical representation.
- To select the task to be studied, you can either use the drop-down menu or click on the icon . This will open a window with a graphical representation of your process. You can then click on the task you wish to study.
- The other step is to choose the graphical representation of your KPI.
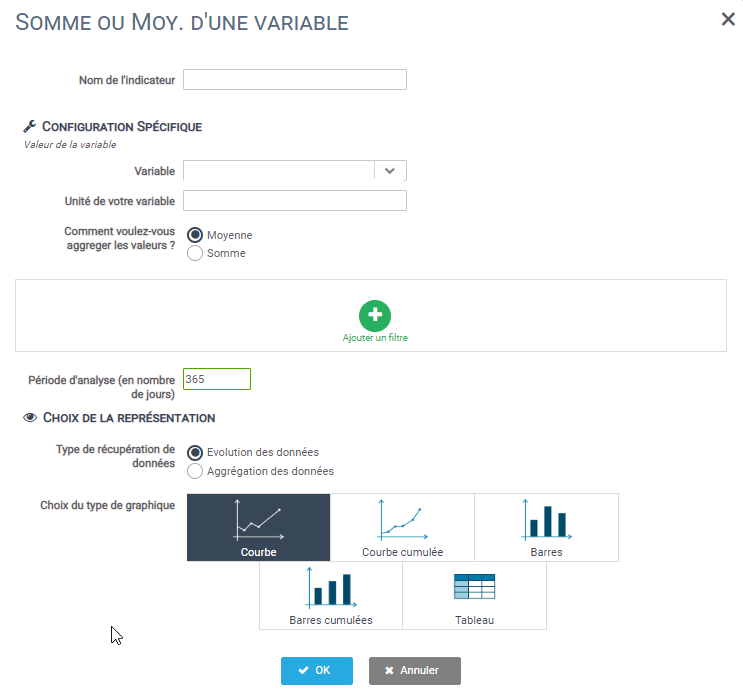
4/ Sum or average of a variable
5/ Sum or average of a variable per process
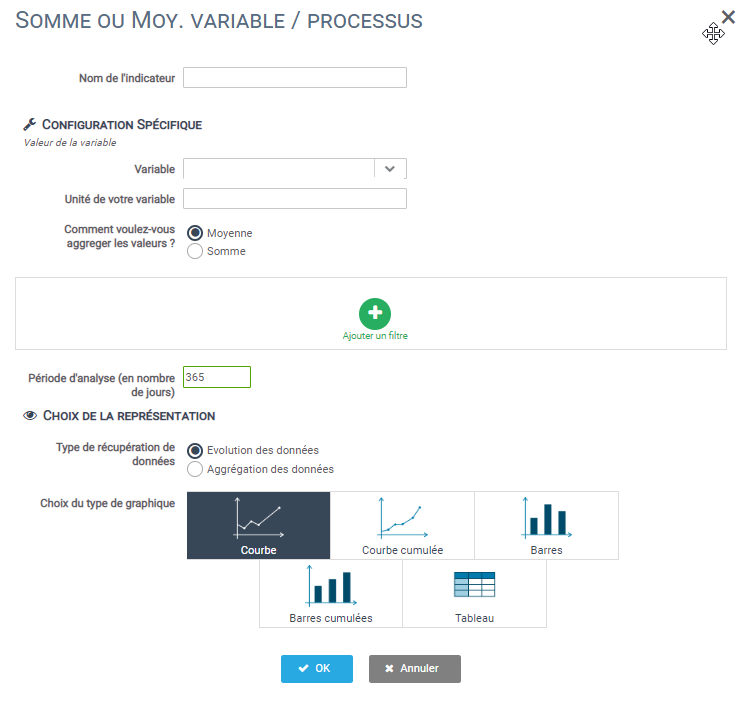
Use
This indicator records the value of a numeric variable in your process for each instantiation. Compared to the template Value of a variable, the difference is that you will have one entry per process, rather than a sum/average sorted by launch date.
In the case of a variable representing a cost, for example, you can easily detect outliers.
Configuration
For this indicator, you will have to define the variable you want to study and then define its graphical representation.

