Creating an indicator: from theory to practice
How to define an indicator?
Before you want to start creating KPIs you need to have in mind the indicator you want to define.
It is important that you can answer the following questions:
- What is the definition of my indicator?
- How is it calculated?
- According to what criteria should my indicator be studied?
- Does the indicator relate to all instances of a process or only a portion of them?
Only after you have thought carefully about your indicator will you be able to define it correctly in Iterop.
Example: the document release process
Let’s imagine a company that regularly has to write technical documents in different languages.
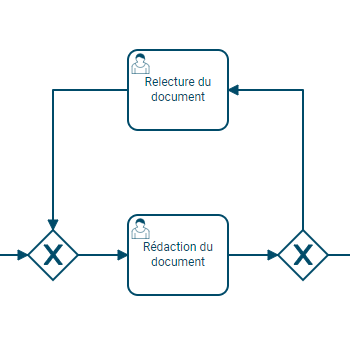
This company uses a document validation process for all the documents it produces.
Each time a new document is drafted, it must be checked by a third party and then reworked by its author until final validation. Here we will evaluate the efficiency of this process.
One of the performance indicators we can think of in this case is:
- The number of return trips required before validating a document. Depending on the position of our indicator in relation to the value one, we will be able to observe the effectiveness of our corrections.
As the company writes articles in English as well as in German or French, it is interesting to separate our result according to the language of the document to be validated.
Finally, in order not to pollute our result with an overload of data, we are only going to consider the documents written over the last two months.
This gives us the following indicator (KPI):
- Definition : Calculate the number of correction steps required when writing a document according to the language of the document.
- Calculation : The number of passes through the validation loop / number of processes launched.
- Additional criteria: The language of the document to be produced.
- Time filter :
- The results of the last two months.
Once the indicator has been defined, we can start the configuration of our indicator in Iterop.
Configuring the KPI in Iterop
Step 1: Create a new indicator
Before creating a new indicator, you must specify the process to which it applies 1️⃣.
In IteropDeisgn, select the tab “Indicators” and click on New indicator in the top right corner, this window opens :
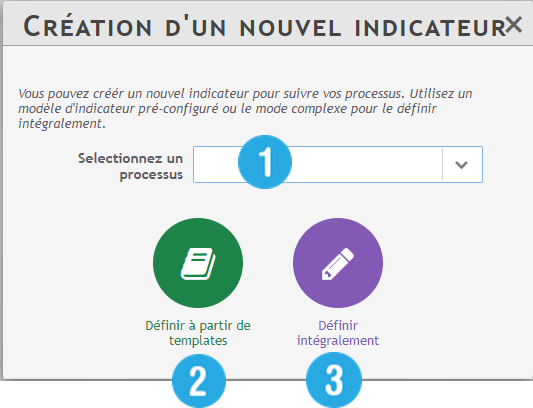
Two editing modes are then proposed to you:
- If your indicator is a current indicator, you can configure it very easily from the creation templates 2️⃣
- If your indicator is complex or too specific to your processes, you will have to go through the advanced mode 3️⃣
In our case, we will use the advanced mode.
Here is an overview of the interface:
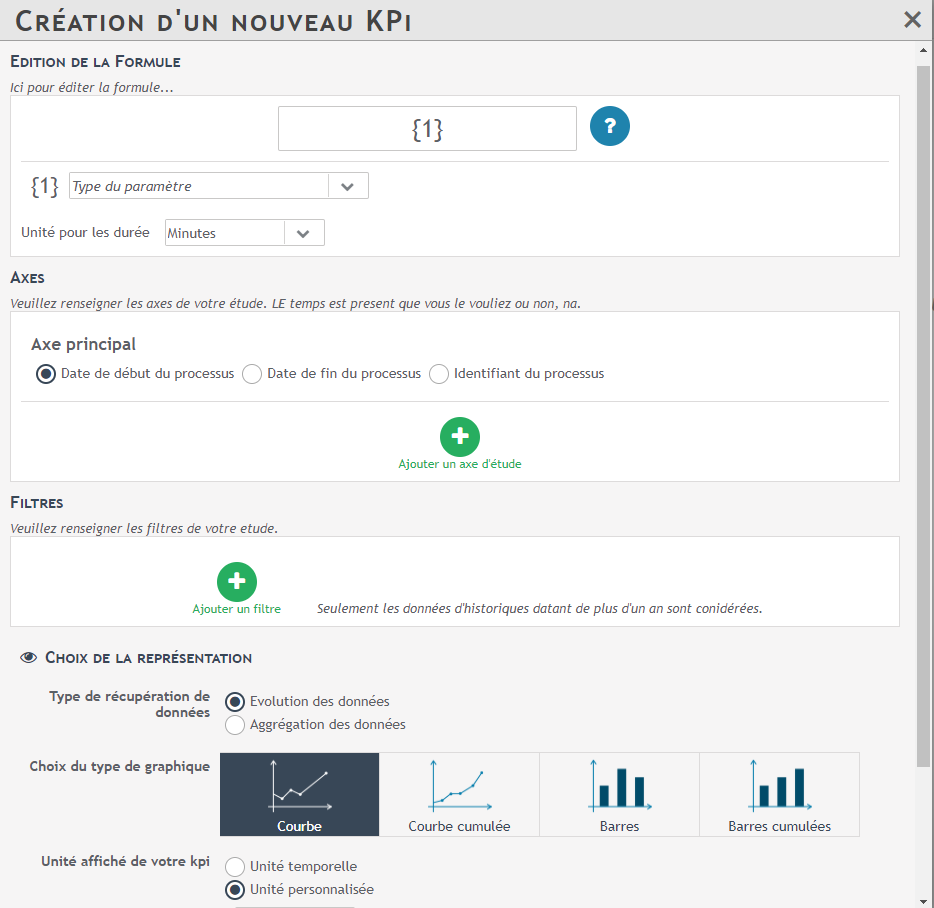
Step 2: Fill in the indicator formula
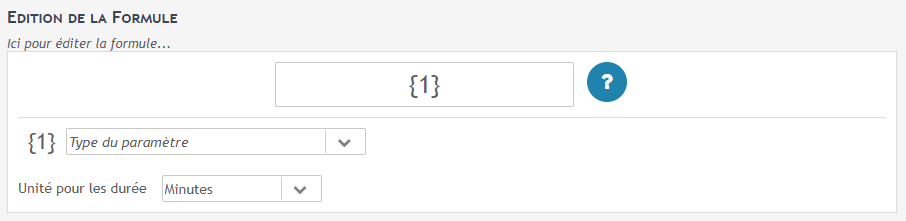
When opening the advanced KPI mode, the first thing to fill in is the formula of our indicator, i.e. the way we are going to calculate it.
- Fill in the form field with :
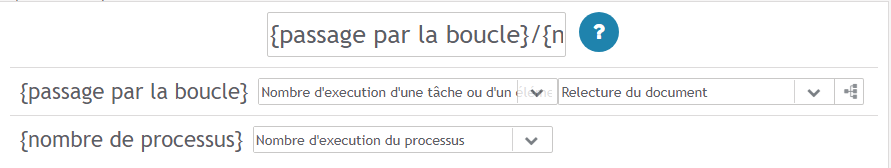
- {passing through the loop} / {number of processes}
- In the Formula field you have to replace your arguments by {name of your argument}.
- As you enter your formula, two boxes appear entitled “pass through loop” and “number of processes“.
- In the first one, choose the argument type “number of passes through a task “
- Select a task internal to the validation loop, such as performing the corrective action.
- In the second box, choose the argument type “number of process execution“.
Step 3: Fill in the indicator axes
In our situation, we decided to sort our results according to the language of the document to validate.
Let’s consider that one of the variables in our process is precisely the language of the document.
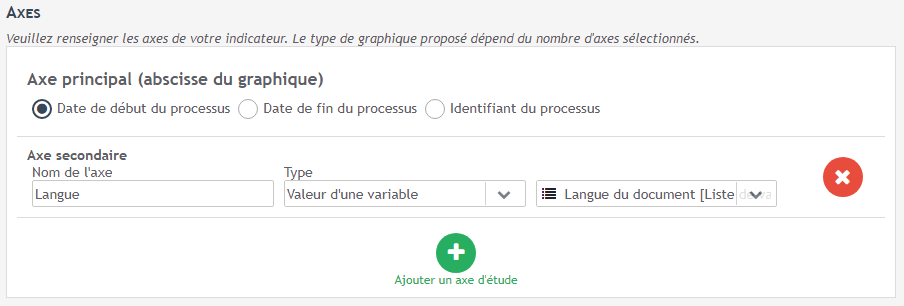
In part Configuration axes :
- We need to determine the main axis. You can choose from the following options:
- The start date of the process (chosen for this example)
- The end date of the process
- A date variable
- The date of execution of a task
- Process identifiers sorted chronologically
- Process identifiers grouped together
- As well as the sub-axis(s) from the following options :
- The value of a variable (chosen for this example)
- The actor of a task
- The initiator of the process
- Purpose of the process
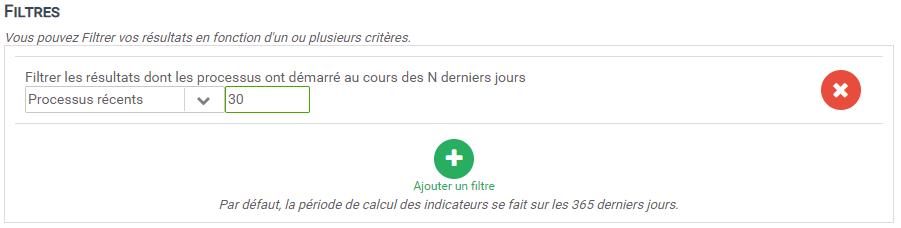
Step 4: Fill in the filters
We will add a filter to our study in order to take into account only recent processes, more precisely those launched less than two months ago.
Other filters are available, such as :
- Duration of the process (less than, greater than, equal to, … N days)
- Duration of a task (inferior, superior, equal, … to N days)
- Value of a variable (if the selected variable is lower, higher, equal, … than the value entered)
- Task completed (if the selected task has been completed)
- Actor of a task (if the selected task was performed by the selected actor)
- Recent processes (processes started within the last N days) (chosen for this example)
- Recently completed processes (processes completed within the last N days)
- Older processes (processes started more than N days ago)
- Processes started after (after the selected date)
- Processes started before (after the selected date)
- Completed Processes
- Ongoing process
- Uninterrupted processes
- Filled variable (where the variable is not empty)
- Existing variable (variable exists but can be empty)
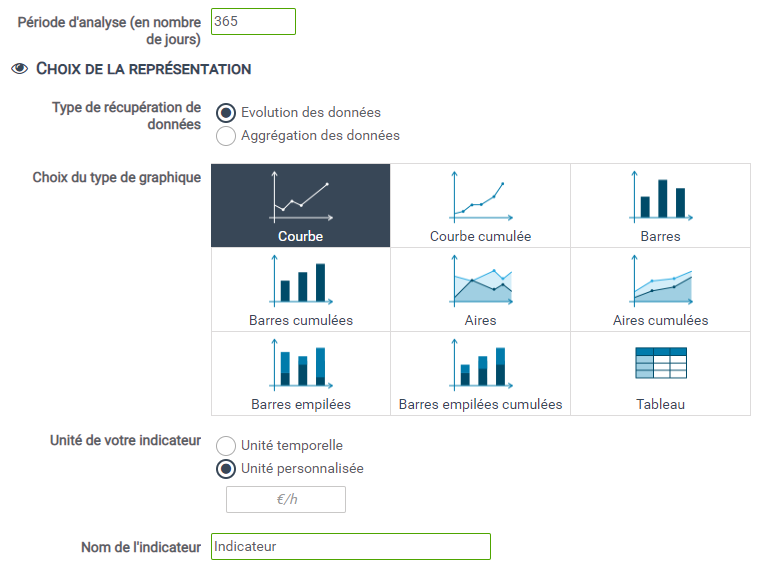
Step 5: Choose the graphical representation of our indicator
The last step of the configuration is to choose the type of graph for the KPI representation. See the specific page representation of an indicator.