
Setting Indicators with Advanced Mode
The advanced creation mode allows you to define indicators in a very precise way in order to be closest to your needs.
Use the indicator formula
The formula of your indicator is how you will calculate its value. While most common indicators have a very simple formulation, such as the number of process executions or the time spent on a defined task, some indicators can be defined in a more complex way.
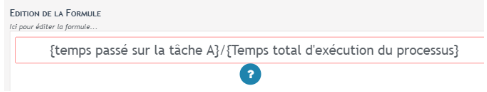
For example, an indicator that expresses the percentage of time spent on a task in relation to the total execution time of your process, or an indicator involving operations on the value of your variables.
In the advanced mode, we propose several types of arguments that you can combine with each other using the 4 common operators. You can also insert numbers in your formulas.
How to write the indicator formula?
Before you begin, it is important that you have the formula for your indicator in mind.

In the formula field, you will have to write the calculation of your KPI by indicating the arguments between braces {code>} .
These are mandatory in order to be able to define your arguments later on. The name does not affect the indicator and just allows you to make the link when editing arguments.
If the formula is valid, the insert is displayed in green.
Define the arguments of the formula
Once you have filled in your formula, you will see as many argument boxes as there are fields entered between braces.
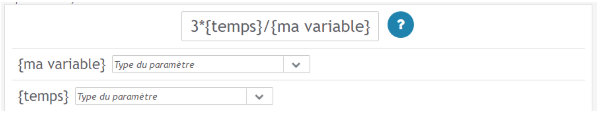
You have to fill in the value of each argument by choosing among those proposed to you.
The different types of arguments
| Name of the argument | Definition |
|---|---|
ACCOUNTING |
|
NUMBER OF TIMES YOUR PROCESS HAS BEEN RUN |
Count of the number of instantiated processes. |
NUMBER OF TIMES A TASK IS EXECUTED IN YOUR PROCESS |
Count of the average number of times a task is executed within the process. if your process goes through this task twice, the value of this argument will be 2. |
NUMBER OF PROCESSES PASSING AT LEAST ONCE THROUGH A GIVEN TASK |
Count of the number of processes or a specific task has been performed.
Contrary to the previous argument, if your process goes through this task several times, the value of this argument will be 1. |
COUNTING THE NUMBER OF UNCOMPLETED PROCESSES |
Count from number of running instances on a process. |
COUNTING THE NUMBER OF UNFINISHED TASKS |
For a given task, number of processes where this task is available but not performed. |
TIME ARGUMENTS |
|
EXECUTION TIME OF YOUR PROCESS |
average runtime total of your process. |
EXECUTION TIME OF ONE OF THE TASKS IN YOUR PROCESS |
Average execution time of a specified task. |
TIME ELAPSED BETWEEN THE START OF A FIRST TASK AND THE END OF ANOTHER TASK |
Time elapsed between the beginning of a task and the end of a second task. Be careful however if your process passes several times through the considered tasks: the calculated time will be the time spent between the first execution of your first task and the last execution of the second one. |
TIME ELAPSED BETWEEN THE END OF A FIRST TASK AND THE START OF ANOTHER TASK |
Time elapsed between the end of one task and the start of another task. Be careful however if your process passes several times through the considered tasks: the calculated time will be the time spent between the first execution of your first task and the last execution of the second one. |
VARIABLES |
|
AVERAGE OF THE VALUE OF A VARIABLE IN YOUR PROCESS |
Average value of a specified variable. If this variable is defined several times in the same process instance, only the last value will be considered. For a variable of type Boolean, a value of 1 is assigned to a yes and 0 to a no. |
THE SUM OF THE VALUE OF A VARIABLE IN YOUR PROCESS |
Sum of the value of a variable in your process. If this variable is defined several times in the same process instance, only the last value will be considered. For a variable of type Boolean, a value of 1 is assigned to a yes and 0 to a no. |
Define the Unit for durations
Under the definition of your arguments you find a field “Unit for duration”. If your KPI has time arguments, this field will allow you to choose if you want them to be in hours, days …
For example, if your KPI is represented by {time spent on a task} and one of your instances has spent a whole day on it, changing the unit will allow you to display 1 (if the unit is in daytime) or 24 (if the unit is in hour).
If your KPI does not have duration arguments or a duration element ratio, this field will not change the results.
Define the main axis
The axes of your KPI are the variables by which you want to study your process.
For example, if you have an indicator calculating the execution time of your process, you might want to sort your results according to who initiated the process.
It’s like asking the question “On what basis should my indicator be seen?”
You would then switch from an indicator with only one curve (the average execution time of the process) to an indicator with one curve per initiator different from your process. You could then compare the different results with each other.
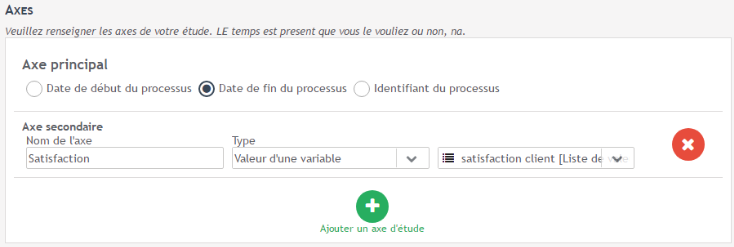
In Iterop, your indicator will always be defined according to a main axis. By default, this axis is the date of launch of your processes, i.e. your data will be sorted and collected according to this date.
However, depending on the meaning of your indicator, you can also choose as the main axis the end date of your processes or the identifier of these processes.
Display of the main axis
By default, your data will be displayed as a function of time.
However, you may not want to see the time scale in your KPI representation but only an indicator.
For example: if you have a KPI that studies
You can set this in the graphical representation part of the KPI.
- Choose “Data evolution”
- Select “Data Aggregations” and enter the number of days you want to display your data for.
Define the secondary axes
You can also add other study axes, called .
The different secondary axes
|
Axis name
|
Definition
|
|---|---|
THE ENDS OF YOUR PROCESSES |
This axis allows you to separate your results according to the eventend of your process. If your process has more than one endpoint, then you can study your indicator according to which endpoint your process has been activated. However, be careful with this axis: According to the BPMN standard, the end events of your processes are not exclusive. That is, you can have a process that has passed through end A and end B at different points in its execution. In the visualisation of your indicator, such a process will then be taken into account in both categories. |
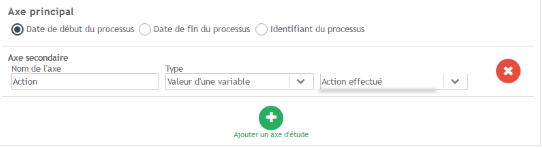
USERS WHO PERFORMED A GIVEN TASK |
This axis allows you to sort your results according to the user who has executed a task that you have specified. This can allow you to easily compare the results of the different actors in your process. Example: In a control process, we must compare how many times Thomas has performed Task A and how many times Laure has performed Task A. |
INITIATING USERS |
This axis allows you to sort your data according to the initiator of your process. À to know the person who started it. This can allow you to easily compare the results of the different actors in your process. Example: In a business process where the number of contracts signed per salesperson must be established. |
VARIABLE VALUE |
This axis allows you to sort your results according to one of the variables of your process. This one is particularly interesting if this variable is a list of choices. Example: Let’s imagine an after-sales service that counts study the time spent to process customer complaints. You need to sort the results according to the action performed and show the difference in processing time between a product repair and a standard exchange. |
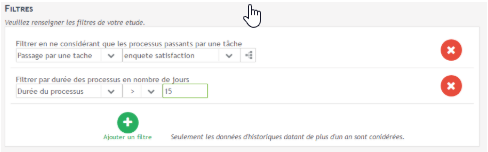
Define filters
You may not want to display results on all runs of your process, but only on certain constrained processes.
For example, you could display only processes with long execution time or only those with a specific task to perform.
The filter part of the Indicator edit mode allows you to define constraints.
The different filters
|
Filter name
|
Definition
|
|---|---|
PROCESS TIME |
This filter allows you to consider only processes whose runtime is greater/less than/equal to a duration that you will have defined (number of days). This filter makes it easy to perform a study of critical processes.critical processes. For example, if you know that your processes must be completed in less than 5 days, you could create an indicator that calculates the number of processes that are longer than 5 days. A value of 0 for this indicator will then indicate a good performance of your service. |
TASK DURATION |
In the same way, this filter allows you to consider only processes whose time to execute a task is greater/less than/equal to a duration that you will have defined (in number of days). This filter also allows you to study critical instances of your process. |
THE USER WHO PERFORMED A TASK |
This filter allows you to consider only processes where a given user has executed a task that you specified. |
PASSAGE THROUGH A TASK |
This filter allows you to consider only process instances that have passed through a task that you specified. |
PROCESS THAT STARTED AFTER |
This filter allows you to enter a date from which you want to take your results into account. All process instances prior to this date will not be considered. |
RECENT PROCESSES |
This filter allows you to consider only processes that have started or finished (depending on your main axis) in the last n days. |
VARIABLE VALUE |
This filter allows to consider only process instances where a defined variable responds to a some condition. For example, in a service department, you could define an indicator that analyzes the effectiveness of the action “Repair the material“. This indicator would then be meaningless when the action to be taken is other than a repair. The filter would be: “Value of a variable” “action performed” “=” “repair”. |
You may as well not define any restrictions or define more than one. It all depends on the results you want to observe.

