
Dive into the heart of performance indicators
Data analysis is a powerful strategic tool. It allows you to transform your data into useful information and gain competitiveness.
In iterop 3.0, you can define, track and share your own KPIs. Thanks to customised dashboards and attractive, interactive visual analyses, you have a clear view of your entire activity: time per job, number of new orders, processing time, etc.
This new tool allows you to define Key Performance Indicators (KPIs) from the data generated during the execution of your processes. These indicators will allow you to measure the effectiveness of your process or service according to your own criteria.
How do I access the indicator configuration?
- The “Indicators” tab can be found in iteropDesign in the menu on the left.
- You can also access the indicators of each process from the “Deployment” view in IteropDesign :
The “Indicators” tab allows you to manage your indicators. In this new interface, you can create, delete or modify any flag associated with a process for which you are the controller.
Define an indicator
Creating an indicator: from theory to practice
How to define an indicator?
Before you want to start creating KPIs you need to have in mind the indicator you want to define.
It is important that you can answer the following questions:
- What is the definition of my indicator?
- How is it calculated?
- According to what criteria should my indicator be studied?
- Does the indicator relate to all instances of a process or only a portion of them?
Only after you have thought carefully about your indicator will you be able to define it correctly in Iterop.
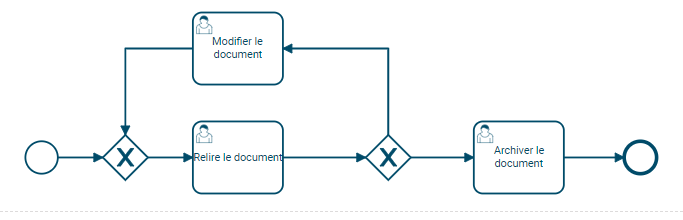
Example: the document release process
Let’s imagine a company that regularly has to write technical documents in different languages.
This company uses a document validation process for all the documents it produces.
Each time a new document is drafted, it must be checked by a third party and then reworked by its author until final validation. Here we will evaluate the efficiency of this process.
One of the performance indicators we can think of in this case is:
- The number of return trips required before validating a document. Depending on the position of our indicator in relation to the value one, we will be able to observe the effectiveness of our corrections.
Since the company writes articles in English as well as in German or French, it is interesting to separate our result according to the language of the document to be validated.
Finally, in order not to pollute our result with an overload of data, we are only going to consider the documents written over the last two months.
This gives us the following indicator (KPI):
- Definition :
- Calculate the number of correction steps required when writing a document according to the language of the document.
- Calculation :
- The number of passes through the validation loop / number of processes started.
- Additional criteria :
- The language of the document to be produced.
- Time filter :
- The results of the last two months.
Once the indicator has been defined, we can start the configuration of our indicator in Iterop.
Setting up an indicator
Step 1: Create a new indicator
In IteropDeisgn, select the “Indicators” tab and click on New Indicator at the top right, this window opens :
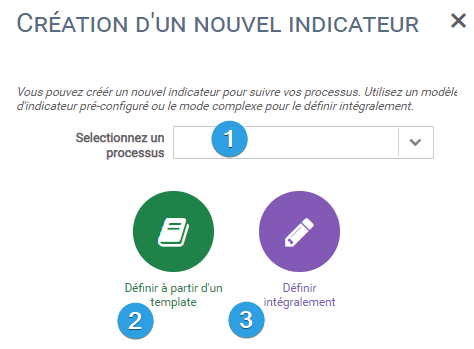
Before creating a new indicator, you must specify the process to which it applies 1️⃣.
Two editing modes are then proposed to you:
- 2️⃣ If your indicator is a current indicator, you will be able to configure it very easily from the creation templates
- 3️⃣ If your indicator is complex or too specific to your processes, you will have to go through the advanced mode
In our case, we will use the advanced mode.
Here is an overview of the interface:
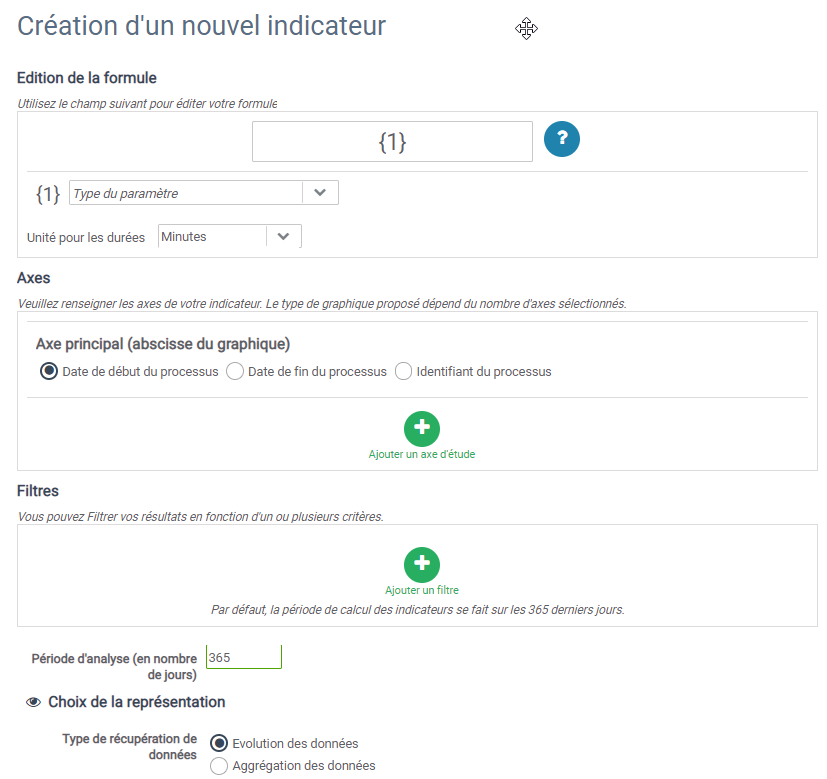
Step 2: Fill in the indicator formula
When opening the advanced KPI mode, the first thing to fill in is the formula of our indicator, i.e. the way we are going to calculate it.
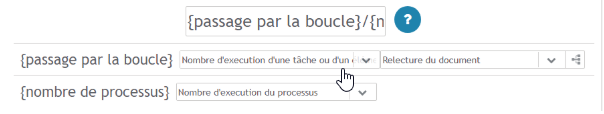
- Fill in the field formula with : {pass through the loop} / {number of processes}
- In the fields Formula you must replace your arguments by {name of your argument}.
- As you enter your formula, two boxes appear entitled “pass through loop” and “number of processes“.
- In the first one, choose the argument type “number of passes through a task“.
- Select a task internal to the validation loop, such as performing the corrective action.
- In the second box, choose the argument type “number of process execution“.
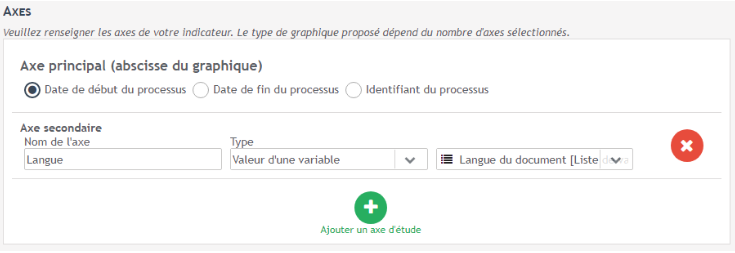
Step 3: Fill in the indicator axes
In our situation, we decided to sort our results according to the language of the document to validate.
Let’s consider that one of the variables in our process is precisely the language of the document.
In part Axes of the configuration :
- you have to add a new axis and define it as the value of a variable : “Document language”.
Step 4: Fill in the filters
We will add a filter to our study in order to take into account only recent processes, more precisely those launched less than two months ago.
Step 5: Choose the graphical representation of our indicator
The last step of the configuration is to choose the type of graph for the KPI representation. See the specific page representation of an indicator.

