
Access the results
Once your simulation is complete, the results are displayed directly in Design in the following format:
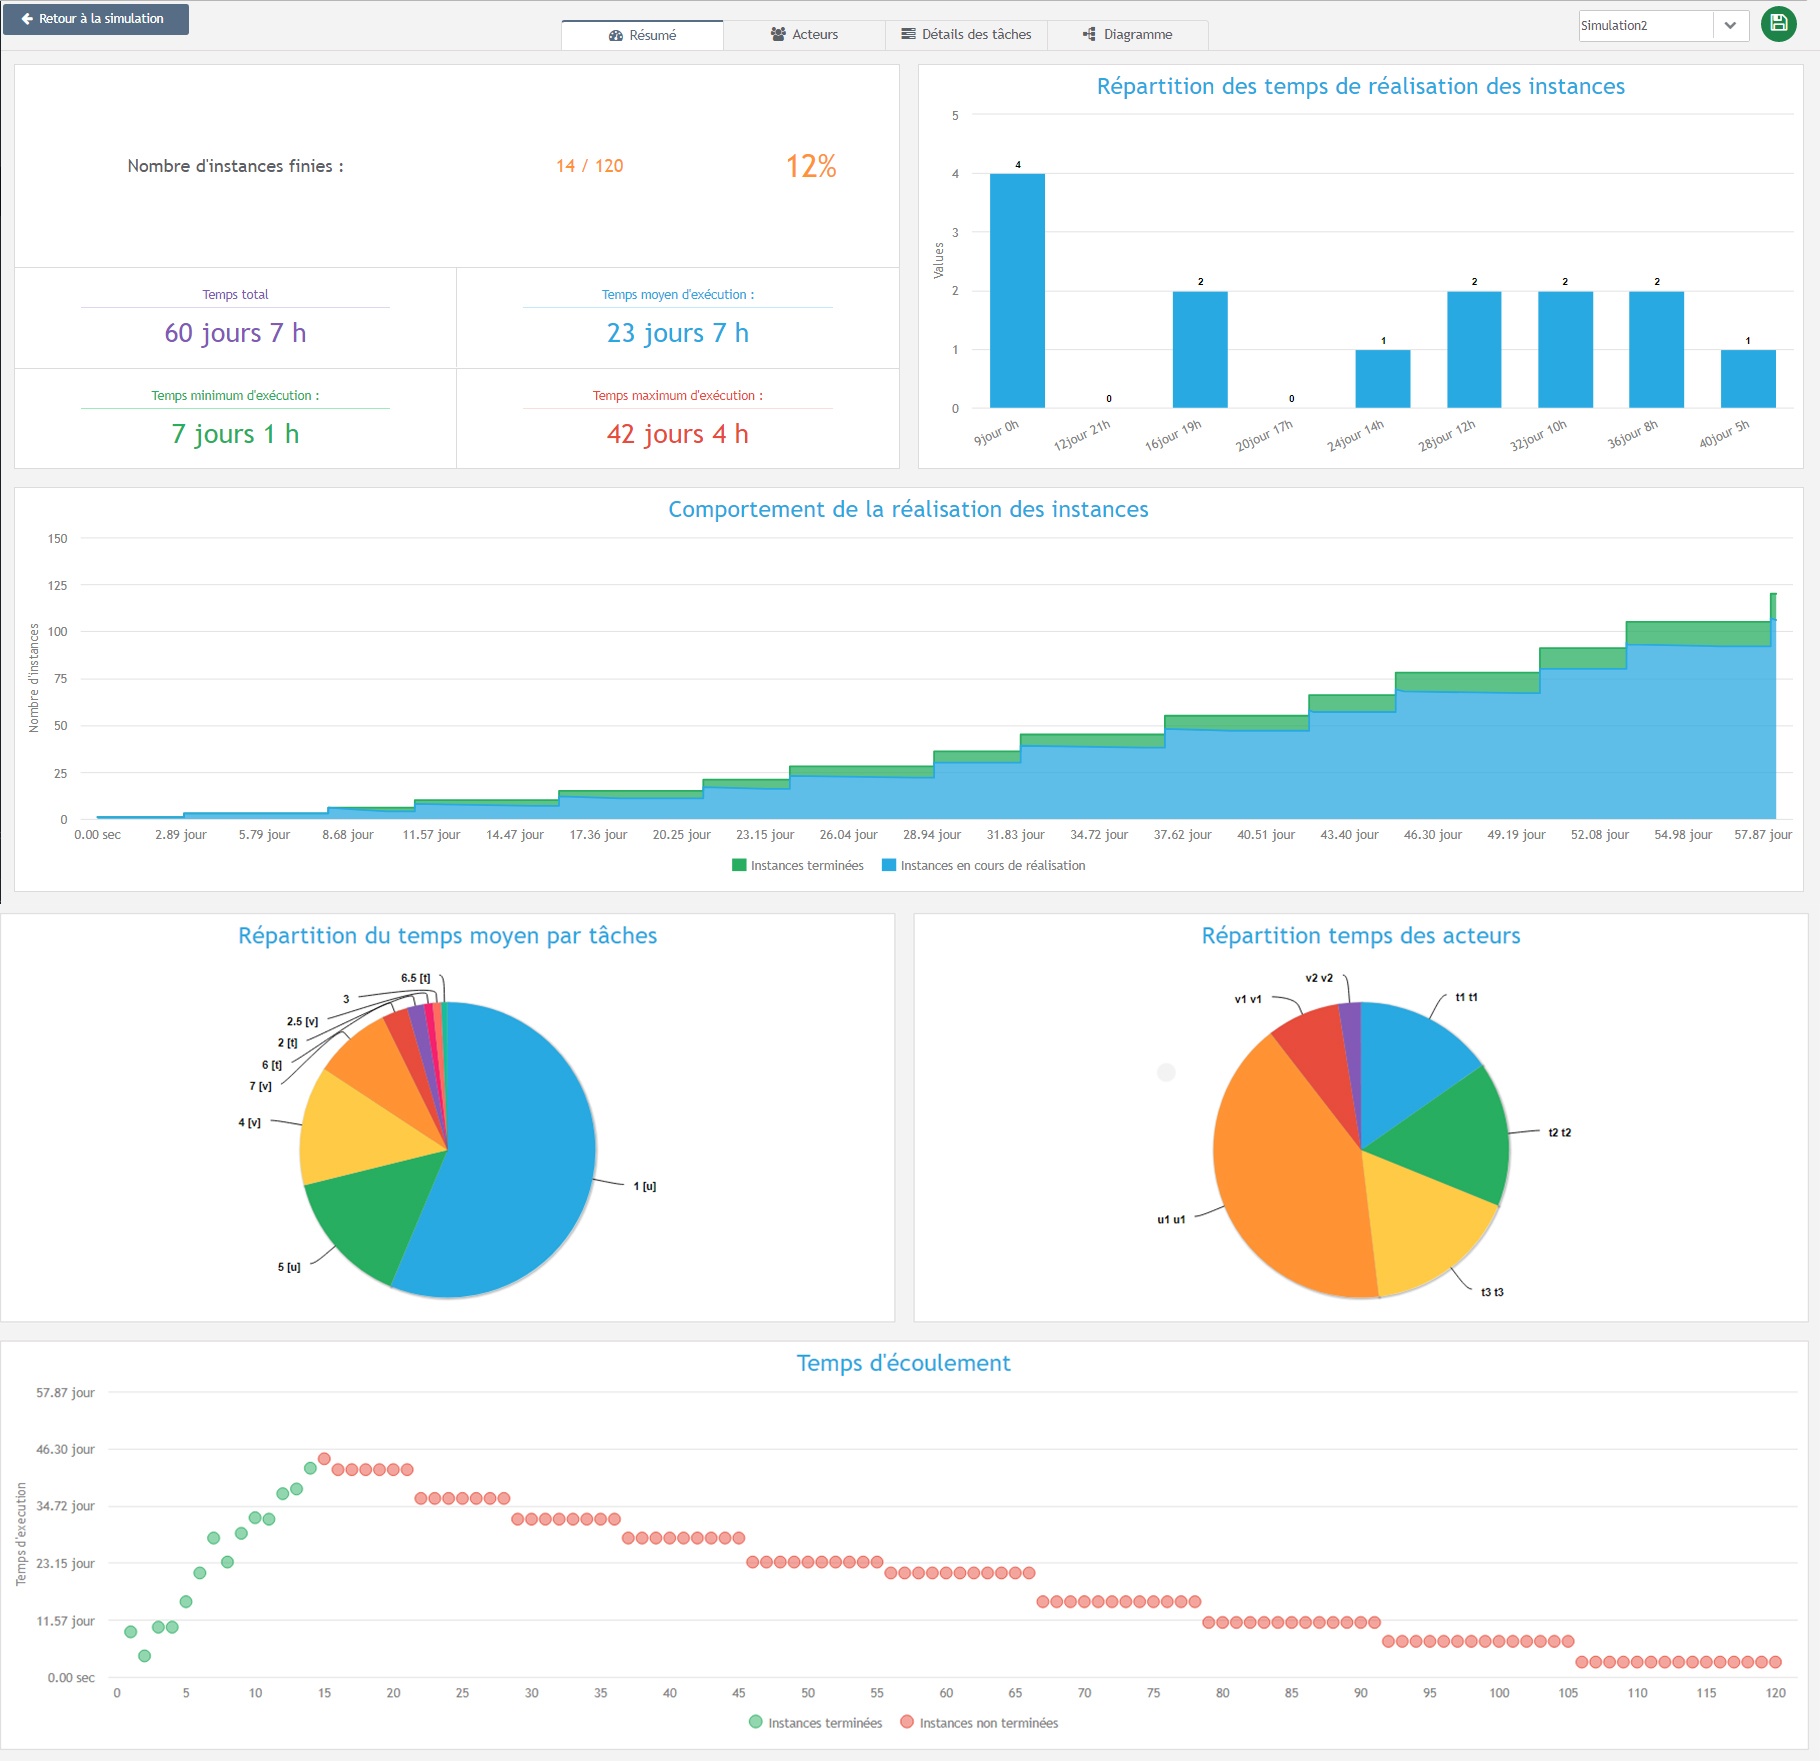
At the top of the page, you can navigate through 4 tabs, each with a respective view.
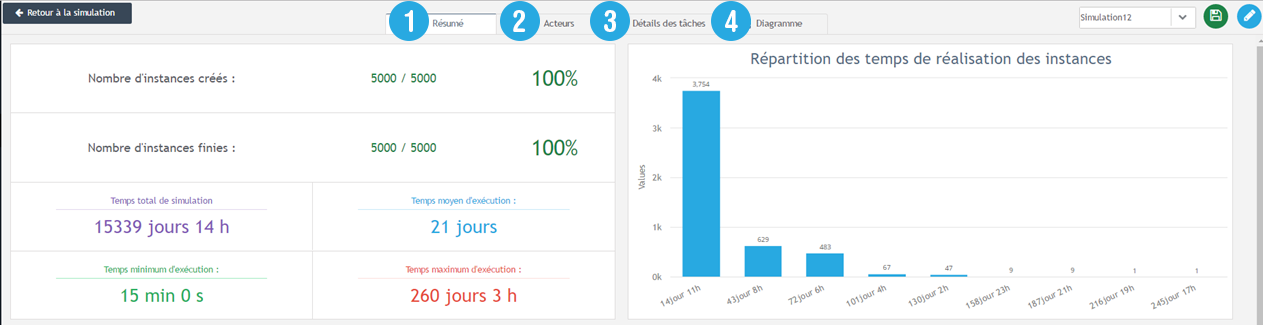
In this summary view 1️⃣ you can see the results of your simulation, the distribution of the time it takes for each instance to run and the number of completed instances. You also have access to the global distribution of each actor’s working time, to see if one of them has a low workload for example.
Finally, the last graphic allows you to see the load in your process.
Vision by actors
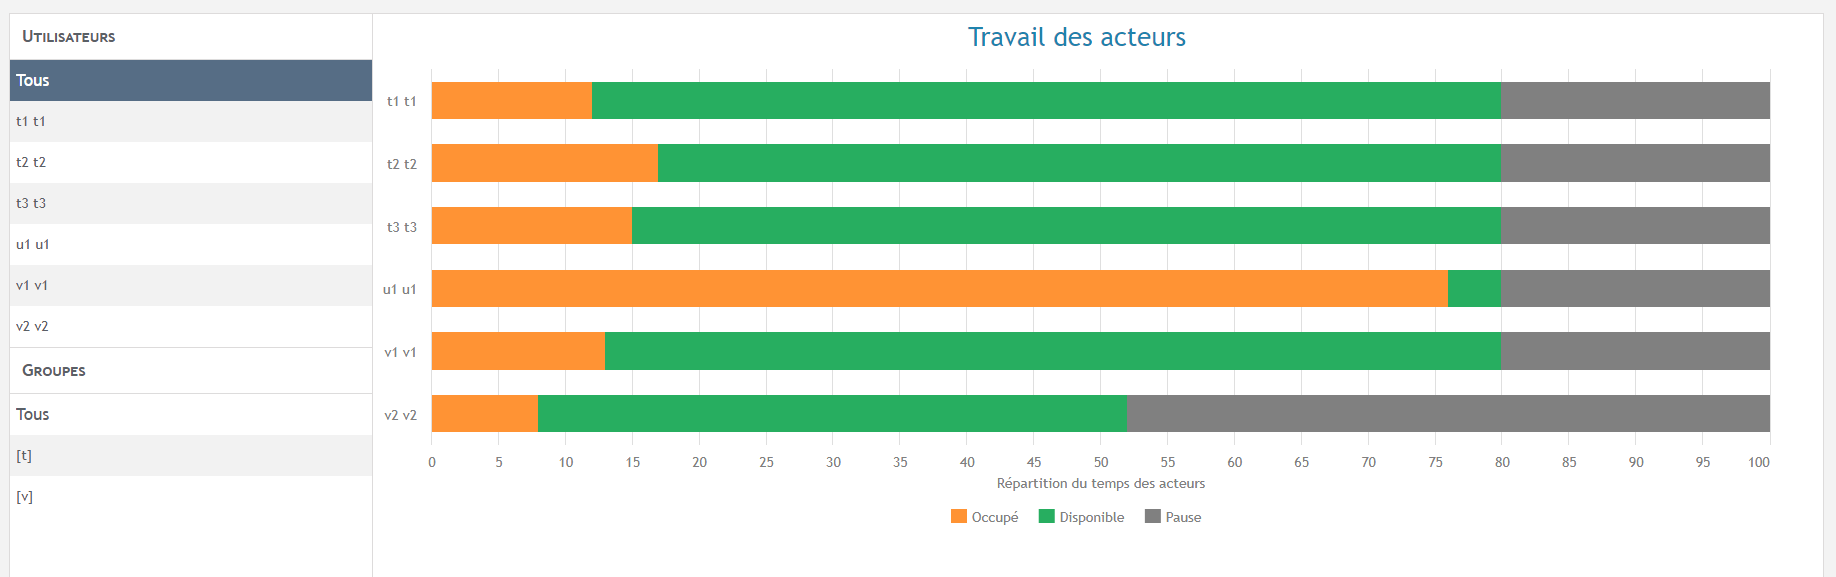
In the Actors tab 2️⃣, you can observe the workload of your teams in more detail. If you select, in the panel on the left, the line “all” a graph will show you the distribution, for each actor, of his time divided between working time, unavailable time and available time.
Then, if you select a actor in particular, you will have access to additional details :
- Time spent on each task
- The number of completions of each task
In this tab, you can, for example, easily spot overloads.
Changing the chart view

The button at the top right allows you to change the display between a graphical view and a table view. In the table view, you can export the data in csv or Excel format.
Vision by task
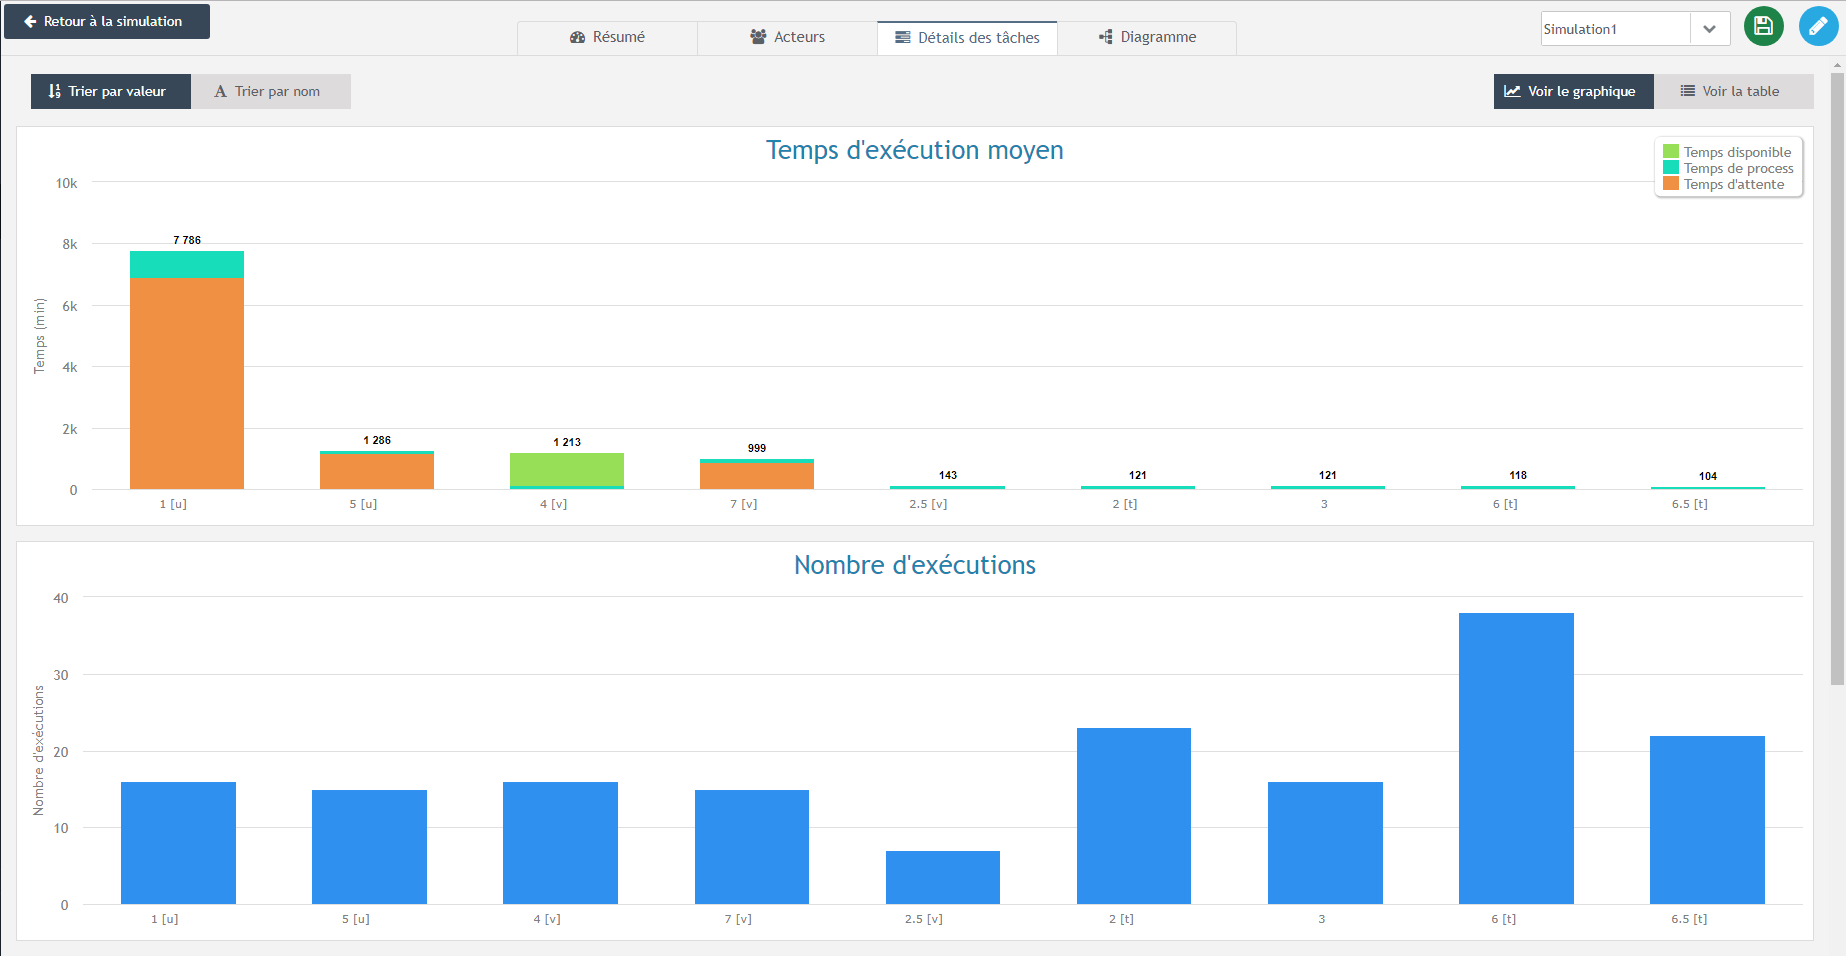
In the Task Details tab 3️⃣, you can see the average time spent on each task as well as the distribution of this time. Indeed, an instance can spend time on a task in three ways:
- Waiting time : the task waits for an actor to be available to begin
- Time to completion strictly speaking
- Availability time : this time appears in the case of a task preceding a parallel logical gate, and means that the task has been completed but the other parallel tasks have not yet been completed.
Changing the chart view
You can also switch from graphical view to table view with the button above, and thus export the data in Excel or csv format.
Viewing the diagram
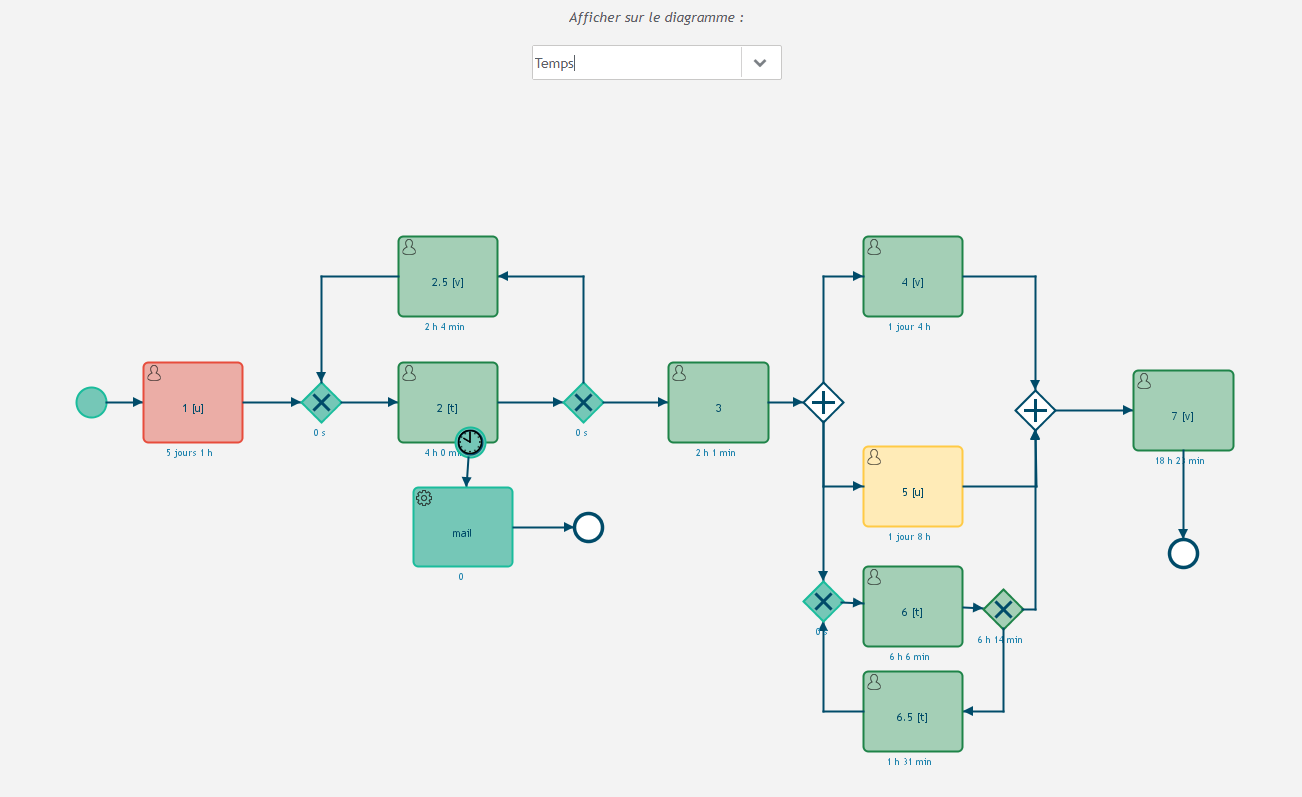
In the Diagram tab 4️⃣, you can display several pieces of information directly on the process diagram.
You can choose to display :
- The number of times tasks are run through the tasks: either globally “task performed 50 times”, or on average “1.2 times per process”.
- The time spent on each task : this time takes into account the waiting time before the task is processed as well as the execution time of the task.
- The load-to-capacity ratio of each of your tasks.
- The number of running instances at the time the simulation stopped.
On this tab, you can quickly identify blocking points in your process.

