
Understanding the dashboard
The tab “Dashboard” allows you to quickly view the last tasks completed, those in progress or the last processes started. This way you can quickly check the progress of your work.
Consult the dashboard
- Click on the “Dashboard” tab located in the left menu
- Check your “Dashboard” :
Here are the types of inserts you can find in the dashboard :
A quick overview of some of the indicators that apply to you: EVERYONE
A quick overview of some of the indicators that apply to you: EVERYONE
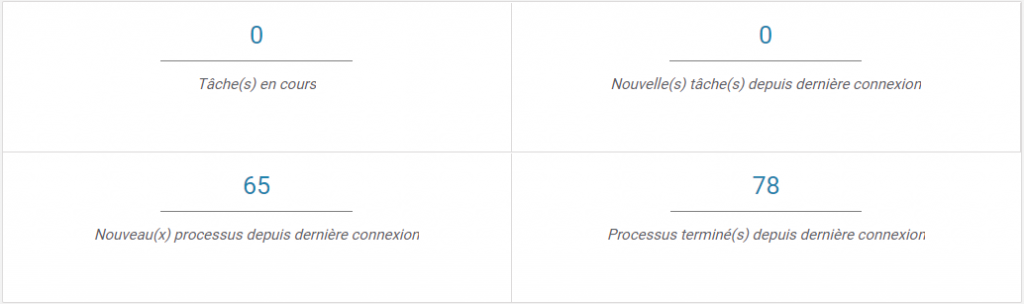
This insert is displayed for all types of users and gives you an overview of your current tasks and the new tasks that have been assigned to you. It can also display new and completed processes according to your rights.
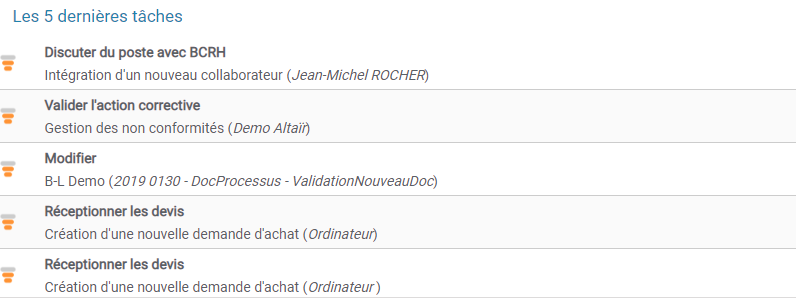
The last 5 tasks assigned to you: EVERYONE
Corresponds to the last 5 tasks assigned to you. You will find the name of the task, the name of the process to which it is linked and its priority. When you click, you are redirected to the task completion window.
Create a new dashboard
From the Play interface, you can customize your dashboards and display only the data you need. With Customizable Widgets, you will define the type of data you want to appear.
To start customizing your dashboard, go to your Play interface, select the tab “Dashboard” and click on the button in the top right corner of the interface.

A creation window opens:
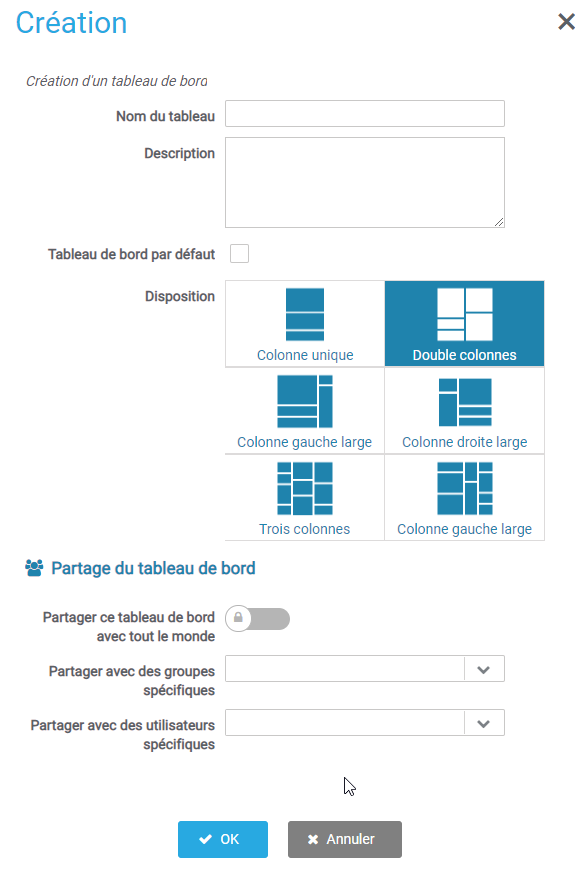
- Enter the name and description of this new custom dashboard in the corresponding fields. This name will be used to identify your table in the list of your different dashboards.
- You can choose to set a dashboard default by checking the box . This table will be displayed first when you log in to the application.
- You can choose how many columns your new dashboard will have. Click on one of the four choices in the layout: . If you plan to consult this dashboard most of the time on a smartphone, prefer the 1-column layout. On the other hand if you work on a desktop computer, you can choose 3 or 4 columns.
- You can decide to share your dashboard. This means that the selected users will then be able to import the array into their own interface. To do this, you choose to share the table with everyone, your users or groups of subscribed users.
- Then click Ok. Your dashboard is now created. You can then start the creation and configuration of several Widgets to fill your new table.
Navigate between several dashboards
In your Play interface, you can navigate between several dashboards.
To change dashboard, you can use the arrow located at the top next to the main title of your dashboard. A drop-down list will open to select another table from all the ones you have created or imported.
Add and modify a Widget
After selecting a dashboard, you can click on the button in the top right corner.
New dotted areas appear on your dashboard, allowing you to create, modify or move Widgets in your dashboard :
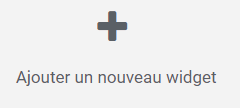
To create a new Widget, click on the frame “Add a new Widget”.
- A window dedicated to the choice of the Widget opens. Choose the desired widget and click Ok. Refer to the following section to configure and use the different Widgets.
- Once configured, it appears in your table :
- You can change the Widget configuration again by clicking on the edit button in the top right corner.
- You can drag and drop the widget by clicking on the title and then dropping it in another column or after another widget.
- Once the widgets have been correctly configured, you can return to the viewing interface by clicking on the button in the top right corner
Use and configuration of the different Widgets
Each widget allows you to have different information and each one has a specific configuration.
General widget configuration
Here is the general configuration that you can find on several widgets :
Name and description: Enter the name of the Widget that will appear in the dashboard. You can also add a description that will be useful for future modification or when you want to import the configuration of another widget already created.
Period: Multiple Widgets allow you to choose a specific search period for the requested information. You have the possibility to :
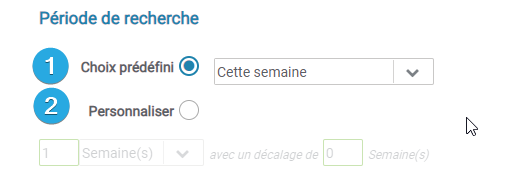
- 1️⃣: Use a quick choice of period. Predefined filters are then proposed to you. If you want to be more precise, you can use the second option “Customize” :
- 2️⃣: Click on “Personalize” . You will be able to choose the extent of the search period with the desired unit of time.
- You can use a time offset. For example, the current week is configured like this :
- Scope of the period: 1
- Unit: Week
- Offset: 0
- On the other hand, if you want to see the last two weeks without the current week :
- Scope of the period: 2
- Unit: Week
- Offset: 1
Example Widget: Current Tasks
This Widget shows you the list of tasks assigned to you. You can set up a search filter on these tasks to quickly view priority tasks for example.
To set it up :
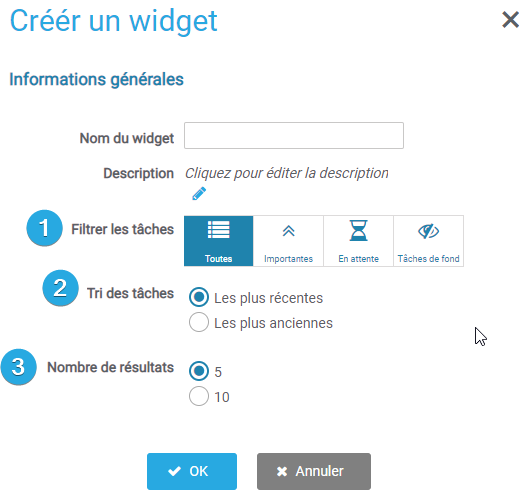
- 1️⃣: Task Filter
- Important corresponds to the tasks modeled and defined as “important”.
- Pending are tasks that you have started and postponed.
- Background task are tasks defined during modeling (ex: cancel a vacation).
- 2️⃣: Sorting by newest or oldest allocation
- 3️⃣: You can display 5 or 10 tasks in the Widget. The size of this one will adapt automatically.
Example Widget: Process History
This Widget allows to display a graph showing the evolution of the started processes over a given period of time as well as the number of running processes. You will be able to choose which processes will be displayed in the Widget.
To set it up :
- Fill in the general information and the desired period
- In the widget’s specific settings, you can choose which processes you decide to display.
If you select too many, it may overload the playback of the displayed graphic.
Example Widget: Activity Status
This Widget allows you to track over a specific period of time the state of the activities of a given process. The activities specified in the configuration will be counted and displayed in the Widget, taking care to separate the activities in progress from those that have been completed.
It is possible to add an objective for each activity.
For example, for a document release process, you will be able to list the number of positive releases, rereadings, changes, etc. over a given period of time.
To set it up :
- Process selection: Select the process whose activities you want to monitor. By choosing a new process, it will instantly modify the right side and reload the activities of this new process in real time.
- Filters : Use the filters on the left to display non-human activities if you decide to follow them.
have chosen the process and activated filters select activities want to follow by checking box left of each activity.>
- Define a goal : By checking the option “choose goals”, a new box will be displayed next to the activities on the right side. This is where you can specify an objective for each activity. These objectives are purely visual and do not affect their execution.
- Progress bar: You can display a progress bar for tasks with goals.
- Tasks of which you are actor : Filter only the tasks of which you are the actor and not all the activities of the processes.
- Display deleted human tasks: This filter is for human tasks only. By checking this option, you can visually separate completed tasks from deleted tasks.
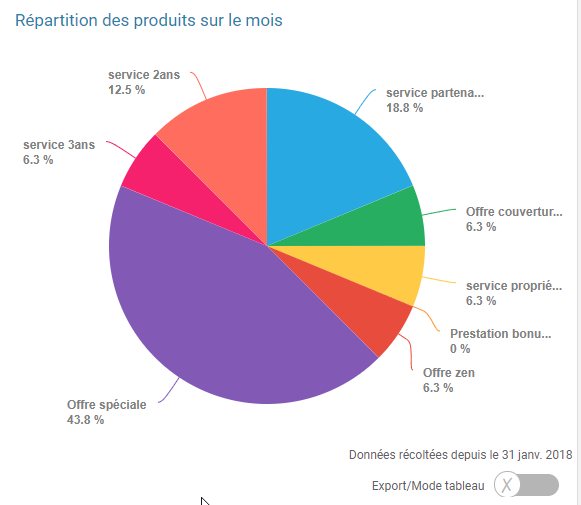
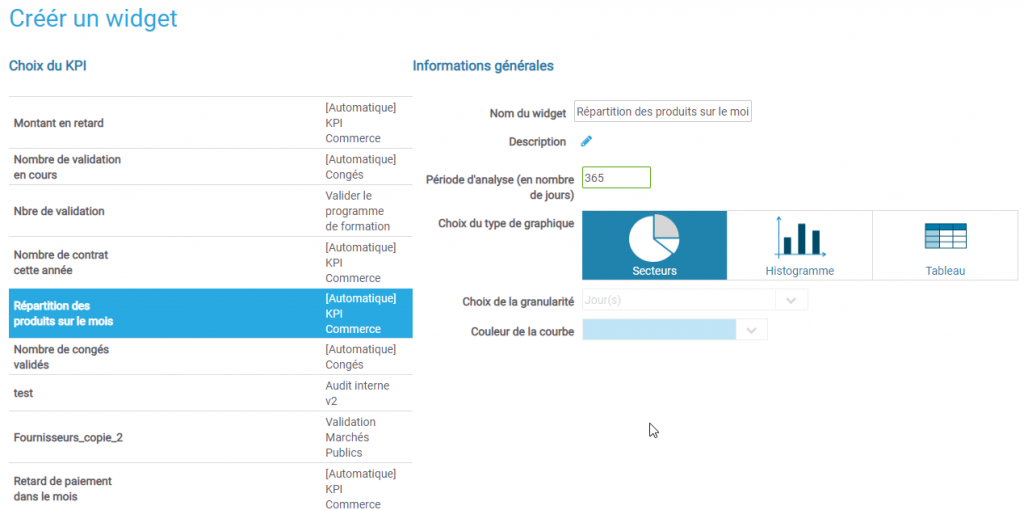
Example widget: Performance Indicators
This Widget allows you to retrieve from iteropDesign, all the indicators you have pre-configured. You can thus create dashboards specific to a department, an actor or an activity.
In the left column, choose the indicator you want to appear among those you have already created.
Name it and choose its graphical representation. To validate, click on “Ok” at the bottom of the window.
Adjust the period taken into account by the widgets
It is possible to display widget data, based on a specific period of time using the button on the right side of your Dashboard window.
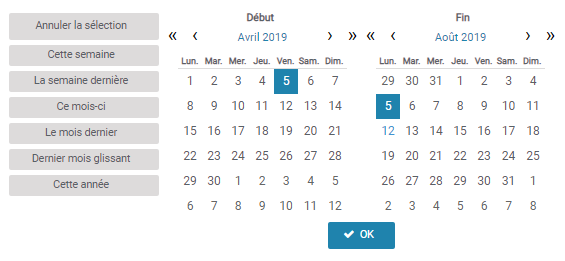
Preview of the period configuration window :
Exporting data from a dashboard
It is possible to export your dashboard data to Excel format so that you can reuse them outside Iterop.
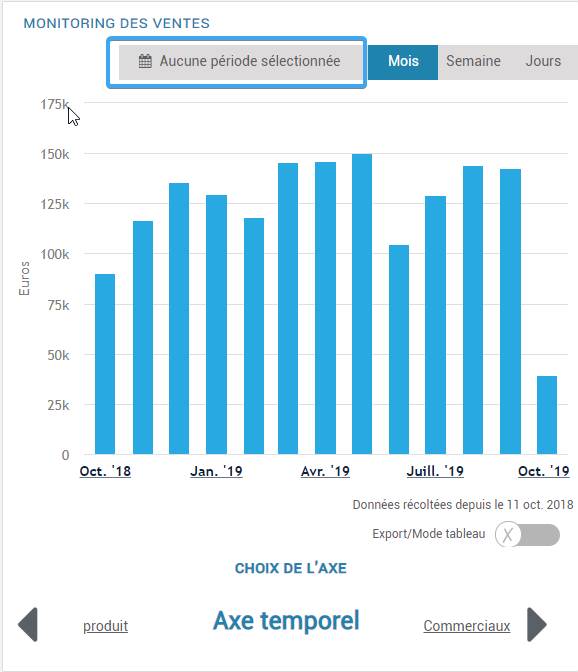
In Iterop Design, go to your dashboard and choose from the data you want to export based on the widgets displayed.
Click on Export Array mode at the bottom right of the widget. At this point, the graphical representation of the data changes and becomes a table.
Click on the button Export Table and choose the format you want. Click Export and your file will automatically download.
Share a dashboard
Once you have set up your dashboard, you can decide whether you want to share it with all your employees or only with some of them.
To share a dashboard, click on edit ⚙ at the top right and in the new window that opens, choose your settings :
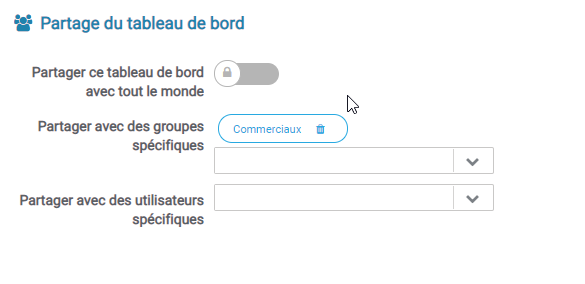
You can decide to share it with all users or select only one actor or group.

